How to benchmark against a subject area

You’ve just received some great news. Your research, published recently in the Journal of Widget Technology, is receiving a lot of attention online. You log into Altmetric Explorer and download all of the discussion data for your article: hundreds of tweets, coverage in a dozen news outlets, and even a citation in a policy document!
You excitedly call your co-authors to share the news. That’s interesting! they say. Is that a lot of attention? How does it compare to other widget studies research? As you hang up the phone, you realise you need a basis of comparison in order to fully understand the significance of the engagement you’ve received. But where do you begin?
Benchmarking drives insight
“Benchmarking” is the practice of understanding your performance by comparing yourself to your peers, typically using metrics. In the world of research, those comparisons are usually made against competing institutions or journals, or even against entire subject areas, using citation-based metrics and other bibliometrics. Approaches to benchmarking altmetrics are not as widely known.
Benchmarking engagement using the Altmetric Attention Score in Context
It’s currently easy to understand the significance of the engagement that an article (or a group of articles) has received as a whole by looking at the Altmetric Attention Score’s percentile performance.
The Altmetric Attention Score is a weighted count of mentions that a research output receives in the sources that Altmetric tracks, based on the relative reach of each source. It gives a sense of the overall diffusion of a piece of research.
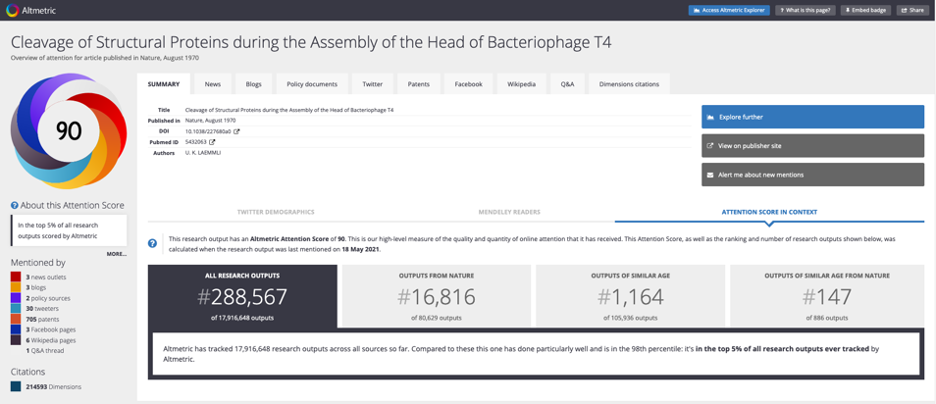
Altmetric compares an article’s Altmetric Attention Score against the Scores of other research published in the same journal within a three month window, to calculate an article’s percentile. We then share this percentile information in each article’s Altmetric Details Page to help you benchmark the performance of one article against similar articles:
“So far Altmetric has tracked 80,629 research outputs from this source [e.g. Nature]. They typically receive a lot more attention than average, with a mean Attention Score of 91.2. This one has done well, scoring higher than 79% of its peers.”
You can check any article’s Altmetric Attention Score percentile on that article’s Altmetric Details Page “Score in Context” tab:
We think this approach works really well for understanding overall engagement for articles published in the journals we track.
But what about comparisons to an entire subject area? And what about benchmarking engagement in specific Altmetric data sources like the news or Facebook?
How to benchmark research against a subject area
Sometimes, you need to understand if research engagement for a group of articles is a lot (or not) compared to other research published in the same discipline. This takes journals out of the equation and allows for direct comparison to research on similar topics.
To start benchmarking, you’ll need to keep some important principles in mind when creating a comparison set.
Understand your subject areas
Databases like Dimensions assign subject areas at the article level. Other databases might assign subject areas to journals, and then consider any article published in that journal to conform to that subject area.
Some subject area frameworks are more precise than others. For example, second-level Field of Research codes (e.g. “Immunology”) are typically more granular than first-level codes (e.g. “Medical Sciences”).
Be informed about how subject areas are assigned in the database you’re using to create a comparison set, as that will affect the conclusions you can draw when making comparisons.
If your article is assigned to more than one subject area, you can compare your article against several comparison sets that reflect those same subject areas. Just take the average value in each subject area and then take the average of those averages to create a single number to benchmark against.
Get the sample size right
You should aim to have a reasonable set of randomly selected articles to compare against. Some researchers will use sets of a few hundred papers, some will use a few thousand. The higher set of numbers should mean the benchmark value is more reliable.
These should be articles published in the same time frame and same subject area.
If you want to get very precise, you can use a sample size calculator to determine how many articles you’d need to ensure that your comparison set is representative of an overall subject area.
Select similar outputs – time and type
Other important considerations for determining “similar” research for comparison are publication time frame and the type of output being compared.
The volume of attention that research receives can vary, depending on when it was published. In general, Altmetric has better coverage for research published January 2011 onward.
If you are benchmarking engagement in fast-moving data sources like social media, consider using a short time window for comparison. A two month window (i.e. comparing research published within one month before and one month after your research) is typically sufficient.
In slower engagement data sources like patent and policy documents, where it can take months or years to be cited, consider using a longer time window for comparison, up to two years.
You’ll also want to make sure you are comparing apples with apples, articles with articles. Altmetric tracks many different research output types. Engagement norms differ for these research formats. For example, researchers and the public share monographs and datasets at different rates than they share journal articles. So, be sure to limit your comparison set to similar output types.
Choose the right metric
There are two ways you can think about benchmarking your research: how often it’s been shared (counts) and what percentage of your research has been shared (coverage).
Counts
If you are trying to understand the relative influence of a single article in a specific Altmetric data source, we recommend using attention counts, contextualised by percentiles.
Percentiles can be a great way to understand if your research is receiving a lot of engagement, compared to all research in related subject areas.
An example of a percentile would be, “My article is in the top 5% of all climate change research published this year, in terms of number of mentions on Twitter.” As mentioned previously, Altmetric uses percentiles to contextualise the Altmetric Attention Score—albeit using other research published in the same journal as the comparison set.
Another example: if you know your nanotechnology article received 200 tweets, you can compare your article’s tweet count to tweet counts for other nanotechnology articles published within two months of your article:
| Your article’s tweets | Article A – tweets | Article B – tweets | Article C – tweets | Article D – tweets |
| 200 | 1 | 3 | 89 | 1,000 |
Because your article’s tweet count is greater than tweet counts for 75% of similar research, you can say your article is in the 75th percentile (or “top 25%”).
Calculating percentiles is a snap in Excel, and it is also easy to implement in a few lines of R or Python code if you are so inclined.
You might ask, why not just use the mean (average) to make a comparison? We recommend avoiding the mean because Altmetric data can be highly skewed. Outliers like this COVID-19 report (shared on Twitter a stunning 162,752 times) can throw off the mean by a lot!
Coverage
If you are comparing groups of articles, sometimes it is useful to know what percentage of those articles has been shared at least once in a specific Altmetric data source.
For example, a journal editor might be interested to know what percentage of her journal’s research goes on to be cited in public policy, and how that compares to research published in her subject area overall.
To calculate coverage, first you will need an accurate sense of all research published in a set of articles—not only those articles that have been tracked by Altmetric. (Contrary to popular belief, we do not track all research ever published). Typically, you can get total publication count information from a citation database like Dimensions or Web of Science.
You can then use this complete list of publications to search Altmetric Explorer, to see how many of those publications were mentioned once or more in a specific Altmetric data source. To do so, in the Explorer Research Outputs tab, download mention counts for your article set, counting the number of articles mentioned once or more in each data source. Divide the “mentioned at least once” number for a data source by the total number of publications and you’ll get your coverage rate for that Altmetric data source.
You’ll need to calculate coverage rates twice: once for your own article set (e.g. all papers published by your journal) and again for your comparison set (e.g. all papers published in the same year, in the same subject area).
Here’s an example for how to visualise the relative coverage of a specific journal in Altmetric data sources, compared to the expected coverage for similar subject area research of the same age:
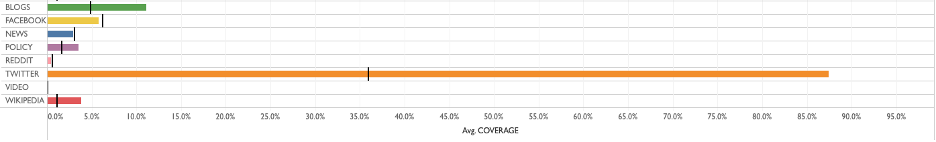
Expected coverage in each Altmetric data source is indicated in the above chart by black strike marks and observed coverage for that journal is illustrated using bars—making it easy to see where a journal has had “breakthrough” success. In the example above, the journal is clearly over-performing in terms of Twitter, blog, and Wikipedia coverage of its articles.
Get started
For more information, check out our webinar on journal benchmarking, led by Altmetric’s head of data insights, Mike Taylor.
Then, if you’re already an Altmetric Explorer subscriber, simply log into Explorer immediately to download data for benchmarking.
If you’re not yet an Altmetric Explorer subscriber and would like to learn more, get in touch! We’d love to discuss how you can use Altmetric Explorer to better understand your organisation’s research influence.
Register here to receive the latest news and updates from Altmetric