23 diverse metrics to use in your next grant application

In yesterday’s post, I shared a new approach to documenting your “broader impacts” in grant applications using metrics and related data, with the aim of giving you solid impact evidence that will send your application to the top of the stack.
Today, let’s talk about some specific types of metrics you can use in your next grant application, including what impacts they communicate and tools that can gather them automatically.
Remember, we’re only interested in metrics that relate to the grant program you’re applying for and inform the type(s) of impact you’re arguing you’ve had. A “kitchen sink” approach this ain’t. Instead, use this guide as a starting point for carefully deciding which metrics are appropriate to include in your next grant application.
Overall attention & reach
“When I track metrics for my research, it’s often to track increases in popularity (using metrics like site views over time, unique vs. total search terms, and other Google Analytics metrics), understand how visitors are getting to my website (using incoming links), and learning more about who is using my scholarship (what countries they live in).” – Holly Bik, microbiologist
What’s the chance that the average person is familiar with your work, having seen it in the press, by visiting your website, or having otherwise come across it online? While most attention metrics can’t guarantee that “clicks on a link == someone has read and fully engaged with your work”, they can more accurately gauge attention to your work than the attention metrics traditionally used: circulation statistics for the journals that print your articles or the number of libraries that own a copy of your book.
- Website visitors: Google Analytics is widely regarded as the easiest to manage, free web analytics tool, and can tell you a lot about how visitors are using your website: how long they’re staying, how many pages they visit, how often users return, etc.
- Mentions in the press: Coverage of your research in a high-profile newspaper like The New York Times can be a great way to get a lot of visibility very quickly. You can find this information using the Altmetric bookmarklet or in Scopus, which recently added mainstream media coverage sourced from Altmetric to the suite of metrics it reports.
- Publisher, repository, and personal website downloads and views: Many publishers and repositories make article view and download statistics available publicly, and some of those that don’t will share that information privately with authors. Visits to scholarship that’s shared on personal websites can be tracked using Google Analytics (see above).
- Twitter exposure: There are a number of services that will tell you how often your tweets or a tweet mentioning your research has appeared in others’ timelines. Altmetric reports the “upper bound” (maximum number) of users who have seen a link to your research in their timelines. Twitter’s analytics tool is a great way to track the overall exposure of your tweets. And there are many, many platforms oriented towards marketers that can be used to further slice and dice your Twitter stats, including Followerwonk and Audience.
- Blog readership: Most blogging platforms like WordPress have a baked-in analytics tool that can tell you how many readers your blog receives, which posts are the most popular, and where in the world your blog is being read. Poke around the backend of your blog to see what’s available to you. For WordPress blogs, I recommend installing the Jetpack plugin, which comes with a solid statistics dashboard.
Engagement
Are you attempting to raise awareness of issues you study among members of the public, policymakers, or scholars in other disciplines? Have you created successful programs in partnership with community organizations that are generating a lot of discussion in your region? Then you’re likely interested in the engagement evidence that the following services provide.
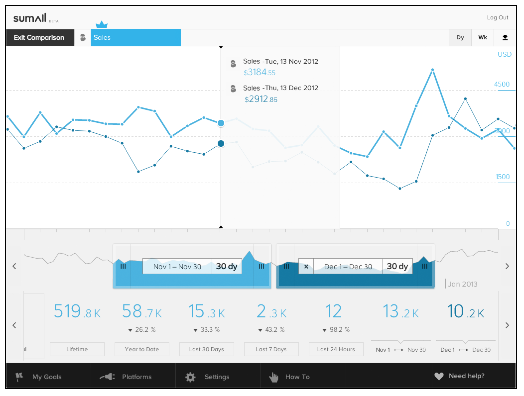
- Social media followers, mentions, retweets, and potential exposure: Sumall is a great tool for tracking your overall engagement on Twitter over time: how many conversations you’re having, how widely your posts and tweets are being seen, and so on. This can be a useful way to know if many people are becoming familiar with you as a researcher. To showcase others’ engagement with your research articles and other outputs, Altmetric and Impactstory both generate reports describing who is saying what about your work, where in the world they’re saying it, and the number Twitter users who have potentially seen a mention of your work in their timeline.
- Blog comments: If you share research-related updates on your blog, the number and context of substantive comments you receive can be one indicator of engagement. For example, when applying for grants human sexuality researcher Dr. Debby Herbenick could describe how she uses her blog to answer readers’ sex and health related questions (slightly NSFW link), while Dr. Rosie Redfeld could explain how her blog’s comments section is a popular place for discussion among scientists in her field.
International reach
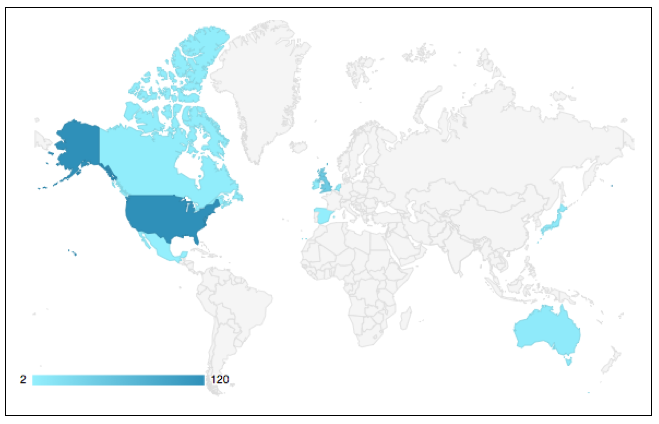
It’s possible your work is being read and reused all over the world. Thanks to the social web’s rich data, it’s now easier than ever to document the international reach of your research.
- Twitter, Mendeley, and Google Analytics maps: Altmetric details pages and Impactstory profiles both generate maps based upon the interest that research has received on Twitter and Mendeley (more on Mendeley below). Google Analytics’ dashboard includes a nice mapping interface, as well.
- International media coverage: Using the mainstream media tracking tools that Altmetric and Scopus offer (mentioned above), it’s relatively easy to find international news outlets that reference your research. Mention is a standalone, paid service that you can also use to track broader mentions to you or your research, based upon keyword searches. Here’s a thorough guide to creating targeted searches on Mention.
Diverse scholarly impacts
Researchers aren’t robots who only ingest scholarship in order to cite it in the peer-reviewed literature. There are a lot of stops along the way during the research lifecycle, and throughout it researchers use web-native tools to manage their reading lists; discuss each others’ work; and recommend the highest-quality scholarship. Following are some examples of metrics from those tools that you can use to showcase the many ways your research is influencing other scholars.
- Mendeley readers and citations: Reference manager Mendeley is used by scholars around the world to save, share, and cite publications. Because Mendeley is a web-native tool, you’re able to gather data from it to learn how many other scholars have saved your articles to their library (a metric that’s been shown to be a solid “leading indicator” for later citations). Mendeley’s also recently added a Stats dashboard that tells you how many times your articles have been cited by research in Scopus. By including Mendeley readership data in a grant application, you’re able to demonstrate that your work is being read by other scholars, and that it may also be used in professional, teaching, and educational activities (for more on Mendeley’s user motivations for bookmarking, see this article by Mohammadi, Thelwall, and Kousha (2015).)
- Discussion on research blogs and Twitter: Scientists and humanists alike use blogs and social media to discuss new developments in their disciplines. (Think of those online spaces as being the equivalent of chats around the water cooler in university hallways.) You can find discussions of your research using the Altmetric bookmarklet, which includes data from a carefully curated list of research blogs and also classifies Twitter users (so you can easily find out roughly how many scholars are discussing your work). Discussions on blogs have been found to have a slight correlation to later citations.
- Recognition on Faculty of 1000 Prime: Articles reviewed on Faculty of 1000 Prime are hand-picked by experts in the sciences, reviewed for their quality and recognized for their contributions to advancing the field, helpfulness in teaching, and other areas. To be reviewed positively on Faculty of 1000 Prime is to have an expert’s stamp of approval on your research. Faculty of 1000 Prime reviews, too, are found to correlate slightly with citations in the peer reviewed literature.
- Web of Science usage counts: Web of Science recently started reporting two types of “usage counts”: full-text requests and exports to reference managers. Full-text requests are counted when a researcher clicks through from the item record to call up a PDF or HTML version of the article (thereby demonstrating more than a passing interest in an article, and a possible intent to read). Exports to reference managers are when a researcher saves a citation from an item record in a format compatible with EndNote or other tools (demonstrating an intent to read and a possible intent to cite the article later on). You can find both types of metrics on the item record for your article in Web of Science.
Attention from practitioners
“Fifty percent of physicians look up conditions on the site, and some are editing articles themselves to improve the quality of available information.” – Julie Beck in The Atlantic
- Wikipedia mentions: Doctors and patients alike use Wikipedia to understand and diagnose illnesses, and many doctors have taken to editing articles to improve the quality of information available, reports The Atlantic. For public health researchers, this fact can make links to their scholarship all the more valuable. You can find Wikipedia mentions for research articles in both the Altmetric bookmarklet and Impactstory.
- PubMed Central views: Many doctors and nurses, lacking subscriptions to the biomedical literature through their hospital, use PubMed Central to research the conditions they treat. Views on PubMed Central can be used to gauge the overall attention that your research has received from those practitioners (as well as members of the public and some researchers). You can find view and download statistics through the NIH Manuscript Submission System or, for PLOS-published articles, on the PLOS article metrics page under the “Viewed” section.
- Citations in public policy: Policymakers use research in their briefs and policy recommendations for a few different reasons: to provide data, to justify an argument, or to introduce new ideas (Haynes et al, 2011). So while being cited in public policy documents isn’t itself a guarantee that your research has made a lasting impact upon policy, the right kinds of citations might. To find citations in public policy documents, you can use the Altmetric bookmarklet (which currently indexes policy from a curated list of governments and NGOs) or a carefully constructed Google Alerts search (see above).
Use of non-article outputs
Many of the above examples relate to the impacts of journal articles, but scholars share many other types of valuable research outputs with the world every day: datasets, software, presentations, and white papers, among others. Here are just a few of the types of metrics you can find for non-article outputs.
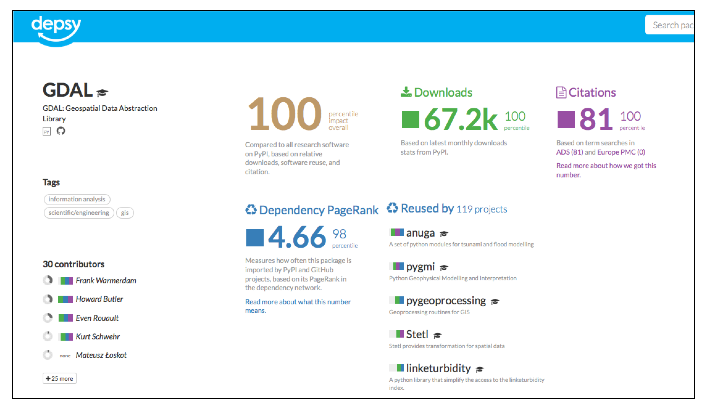
- Downloads of software, data, presentations, and white papers: What’s the level of attention your research has received? If you’ve shared your research online, chances are there are download statistics available for it. Outputs shared on repositories like Figshare and Dryad have pageview and download stats available on item’s pages; you can find download stats for Python and R-based software shared on GitHub on Depsy; and presentations shared on Slideshare have download and view statistics readily available either through the presentation’s web page or–if you have a profile–on Impactstory.
- Inclusion of software in influential software libraries: Maybe a script you created is used as part of another piece of software that is widely used in your discipline. If that’s the case, you’ve had a lot of indirect impact upon computing in your field, and you should be recognized for it. Impactstory’s new webapp, Depsy, uses a Google-like “dependency PageRank” to highlight when Python and R-based software is used as the building blocks for more influential projects. Search for your own project on Depsy.
- Citations to software and data: Formal citations to software can be found using tools like the Data Citation Index. However, those citations make up just a small number of overall citations that software and data tend to receive. More often, data and software are cited informally in the Methods or Acknowledgements sections of research articles. To find those citations, I recommend Depsy’s citation tracker (for software) or Web of Science’s Cited Reference Search (both software and data).
Technology commercialization
“Scientists who work on applied research tend to patent more than academics who pursue basic research.” – Calderini et al. 2007 in Markman, Siegel and Wright, 2008
- Citations in patents: the citation of your patent in other patents can tell you about the potential effects your work has had upon the commercial sector (assuming that the citing patent filed goes on to be commercialized). Whether your work has been cited by American or European patents makes a difference though, a USPTO rules mean that US patents generally receive more citations. A thorough guide to searching USPTO patents can be found here–use the “ref/” prefix and your patent number or the drop-down “Patent Number” Field to search for patents that cite your own on the USPTO website.
Educational impact
“To enable learning programming at scale, I created Online Python Tutor (pythontutor.com), a code visualization and social learning platform that has been used by over 1.5 million people in 180 countries to visualize over 13 million pieces of code.” – Philip Guo, computer scientist
- Use of learning objects: The example above from Philip Guo showcases how a non-traditional “learning object” has had a broad impact. If you’ve made your research or educational outputs available on your personal website, Google Analytics or Mixpanel are your best bets to track the attention that your work has received. If your outputs are in a repository like Figshare, you can use those systems’ built-in reports to find the number of download and views you’ve received, or the Altmetric bookmarklet to discover where that work has been discussed and shared on the social web.
- Inclusion of research in syllabi: If your work is considered canonical in your field, chances are that it’s being used to teach. Unfortunately, it’s difficult to find syllabi where your work has been mentioned, as many instructors are now walling off access to their class materials using systems like Blackboard. One solution around this is Dan Cohen’s Syllabus Finder tool, which scraped the Web between 2002-2009 to collect syllabi. While it’s limited, it is currently the best tool available for searching syllabi.
- Recognition by experts in F1000 Prime: F1000 Prime reviews sometimes recognize scholarship as being “good for teaching”. This information, coupled with the data suggested above, can show that your work is not only used by many, but also recommended by experts in your discipline.
Impact for recently published work
Citations are still the gold standard in many circles for having lasting impact upon a discipline, but they can take years to accumulate. So, how can you showcase the potential for long-term impact upon a field for papers you’ve only recently published? Three “leading indicators” you might consider using to do so are: Mendeley readers (moderate correlation with later citations), Faculty of 1000 Prime reviews (slight correlation), and mentions on research blogs (slight correlation).
It’s important to keep in mind that the potential for later citations is not the most compelling type of impact that your work may have (even if it is the metric that academia’s most obsessed with). Altmetrics are useful precisely because they help fill in the gaps in knowledge we have about items’ impact, and because many of them do not correlate with citations at all. Instead, they tell us something else about the many flavors of impact our work might have.
Make the data meaningful
The best ways to make any metrics you provide useful to grant reviewers are to include relevant qualitative data and context for the numbers you list.
Most of the services listed above that are used to find metrics can also be used to find the qualitative data that comprises those metrics. It’s often more compelling to know that a Nobel laureate has positively reviewed your work on Faculty of 1000 Prime than it is to know that you’ve gotten 15 Faculty of 1000 Prime reviews. So, include relevant examples in addition to the numbers wherever possible.
You should also provide context in the form of percentiles where you can. Are those 15 Faculty of 1000 Prime reviews a lot or a little, compared to the number that other articles in your discipline receive? It’s more useful to say that you’ve got 15 reviews, which puts your article in the top 99th percentile of other articles published in your field in the same year. Impactstory provides percentiles for all the metrics it offers, and Altmetric offers percentiles for the Altmetric score of each article (a summary of the overall quantity of online attention that research has received).
Where to include this data
There are many places you can include impact evidence during the grant application process:
- In your NSF or NIH Biosketch, when describing important or relevant work (aka “synergistic activities” or “contributions to science”) you’ve done
- In your grant narrative or cover letter, when describing why certain past projects make you well-suited for the current line of inquiry you seek funding for
- In your results from Prior NSF Support section, when describing the intellectual merit or broader impacts of that previous research
- Wherever else you are asked to provide evidence for engagement
A great guide to documenting impacts in NIH Biosketches comes from Karen Gutzman and Pamela Shaw, both librarians at Northwestern University who regularly help researchers craft winning NIH grants. In it, they recommend that researchers:
- Consider all their research outputs
- Highlight the full range of those outputs
- Discuss the specific impacts of one or more outputs
- Showcase successful dissemination to stakeholders like the public or other researchers
You can also use the above metrics as possible evaluation criteria for the grant you’re currently applying for. Consider how you might use such metrics to evaluate the success of your work, if you get funded, and include them in your application along with your specific plans to track these metrics.
Have you used metrics or other research impact data in a grant application? We’d love to hear about your experience in the comments below. What data did you include? How did you include it? What was the result of your application?
Register here to receive the latest news and updates from Altmetric