Numbers behind Numbers: The Altmetric Attention Score and Sources Explained

In the last blog post in our researcher series, we included some perspectives on Altmetric from some metrics-savvy researchers. One of the responses was from Jean Peccoud, who commented on the Altmetric attention score, saying it “can [sometimes] feel a little like black magic”.
This isn’t the first time we’ve heard this, or similar, and we appreciate that people are keen to understand more about what goes on in the background to calculate the score for each research output. Our aim for this blog post, therefore, is to provide more detail around the Altmetric scoring system, and to offer insight into the weighting we give to each source we’re tracking.
We hope this post will help to answer some of the questions researchers new to altmetrics may have about how Altmetric collects and displays attention data. For those who are already familiar with Altmetric and use it to monitor the attention for their research, we hope this post will refresh their memories and provide a bit more context around the data.
Where can I find the Altmetric attention score?

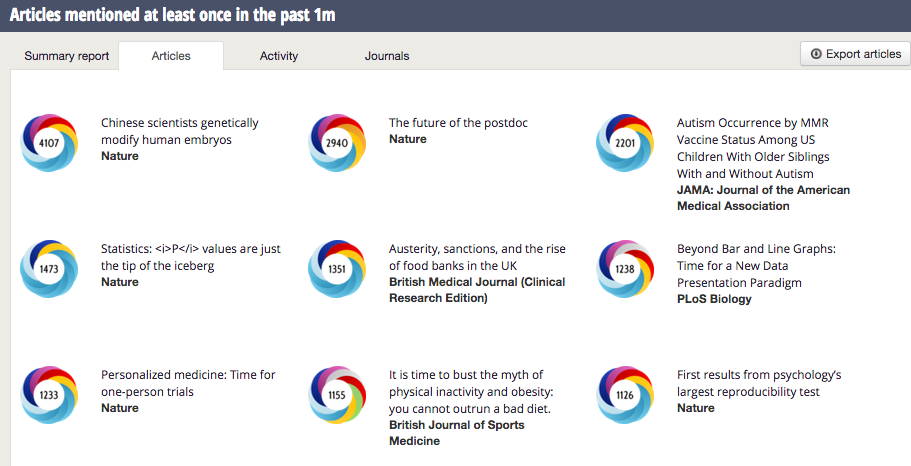
The Altmetric attention score appears in the middle of each Altmetric donut, which is our graphical representation of the attention surrounding a research output. It can often be found on publisher article pages, and also appears when a user is using any of our apps, or using the Altmetric Bookmarklet.
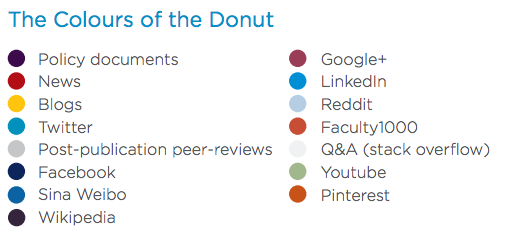
The colours of the donut represent the different sources of attention for each output:
Why do Altmetric assign a score for articles at all?
The Altmetric attention score is intended to provide an indicator of the attention surrounding a research output. Although it may be straightforward enough to monitor the attention surrounding one research output, for example, it becomes harder to identify where to focus your efforts when looking at a larger set. The number alone can of course not tell you anything about what prompted the attention, where it came from, or what people were saying, but it does at least give you a place to start – “is there online activity around this research output that would be worth investigating further?”
We work with a lot of publishers and institutions who want to be able to see which articles are getting the most (or indeed the least) attention. They’re interested in monitoring the attention of not only single articles, but to be able to place that measure within the context of the journal the article comes from, or in comparison with other publications from peers. Again, we’d always encourage anyone looking at our data to also click through to the Altmetric details page for each output content of the mentions and see what people are saying about the item, rather than using the arbitrary numbers to draw conclusions about the research.
How is the attention score calculated?
The Altmetric attention score is an automatically calculated, weighted algorithm. It is based on 3 main factors:
1. The volume of the mentions (how many were there?)
2. The source of the mentions (were they high-profile news stories, re-tweets, or perhaps a Wikipedia reference?)
3. The author of the mentions (was it the journal publisher, or an influential academic?)
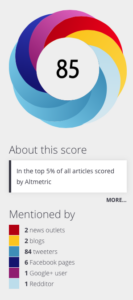
Combined, the score represents a weighted approximation of all the attention we’ve picked up for a research output, rather than a raw total of the number of mentions. You can see this in the example on the right – the article has been mentioned in 2 news outlets, 2 blogs, 6 Facebook posts, 84 tweets, 1 Google + posts and 1 Reddit post. However, the score is 85, not 116.
That said, each source is assigned a default score contribution – as detailed in the list below:
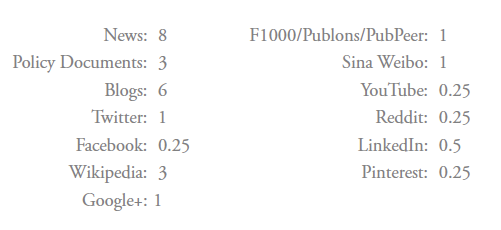
These default scores are designed to reflect the reach and level of engagement of each source: a news story, for example, is for the most part likely to be seen by a far wider audience than a single tweet or Facebook post. It’s also worth mentioning that social media posts are scored per user. This means that if someone tweets about the same research output twice, only the first tweet will count. Blog posts are scored per feed; if two posts that were stored in the same RSS feed link to the same article, only the first post will be counted.
You’ll have noticed that the Altmetric attention score for any individual research output is always a whole number – so each time a new mention is picked up the score is rounded to the nearest whole number. For example, a single Facebook post about an article would contribute 0.25 to the score, but if there was only one post, the score for that article would be 1. However, if there were four Facebook posts mentioning a research output, this would still only contribute 1 to the overall score.
Weighting the score
Beyond tracking and calculating based on these default score contributions, another level of filtering is applied to try to more accurately reflect the type and reach of attention a research output has had. This is where the ‘bias’ and ‘audience’ of specific sources plays a further part in determining the final score.
News outlets
News sites are each assigned a tier, which determines the amount that any mention from them will contribute to the score, according to the reach we determine that specific news outlet to have. This means that a news mention from the New York Times will contribute more towards the score than a mention from a niche news publication with a smaller readership, such as 2Minute Medicine. Each mention is counted on the basis of the ‘author’ of the post – therefore if a news source publishes two news stories about the same article, these would only be counted as one news mention.
Wikipedia
In addition to the news weighting, scoring for Wikipedia is static. This means that if an article is mentioned in one Wikipedia post, the score will automatically increase by 3. However, if an article is mentioned in several Wikipedia posts, the score will still only increase by 3. The rationale behind this is that Wikipedia articles can reference hundreds of research outputs. As such, a mention of a paper as a reference alongside lots of other research, is not really comparable (in terms of reach and attention) to a mainstream news story that is only about one research paper. We consulted a Wikipedia expert when trying to decide on the appropriate scoring, and eventually decided to keep the score static to reduce the potential for gaming. We agreed that if we were to decide that score would increase with each Wikipedia mention, people could potentially game the scoring by manually adding their publications as references to old articles. This would mean that their scores were biased through illegitimate attention.
Policy Documents
The scoring for policy documents depends on the number of policy sources that have mentioned a paper. Mentions in multiple policy documents from the same policy source only count once. If, for example, a research output is mentioned in two policy documents from the same source, this will contribute 3 to the score. However, if two policy documents from two different policy sources mention the same research output, these would both count towards the score, so the score would increase by 6.
Social media posts
For Twitter and Sina Weibo, the original tweet or post counts for 1, but retweets or reposts count for 0.85, as this type of attention is more secondhand (and therefore does not reflect as much engagement as the initial post). Again, the author rule applies; if the same Twitter account tweets a the same link to a paper more than once, only the first tweet will actually count towards the score (although you’d still be able to see all of the tweets on the details page). For tweets, we also apply modifiers that can sometimes mean the original Tweet contributes less than 1 to an article score. These modifiers are based on three principles:
- Reach – how many people is this mention going to reach? (This is based on the number of people following the relevant account)
- Promiscuity – how often does this person Tweet about research outputs? (This is derived from the amount of articles mentioned by this Twitter account in a given time period).
- Bias – is this person tweeting about lots of articles from the same journal, thereby suggesting promotional intent?
These principles mean that if (for example) a journal Twitter account regularly tweets about papers they have just published, these tweets would contribute less to the scores for these articles than tweets from individual researchers who have read the article and just want to share it – again, here we are trying to reflect the true engagement and reach of the research shared. This can also work the other way; if (for example) a hugely influential figure such as Barack Obama were to tweet a paper, this tweet would have a default score contribution of 1.1, which could be rounded up to a contribution of 2.
Combating gaming
Gaming is often mentioned as a risk of altmetrics (as a principle, it is actually applicable to any kind of metric that can be influenced by outside behaviour). Researchers are keen to compare themselves to others and many in the academic world have taken to using numbers as a proxy for ‘impact’. Altmetric have taken steps to combat practices that could be suspected gaming or otherwise negatively influencing the score, including:
- Capping measures for articles that have more than 200 Twitter or Facebook posts with the exact same content. For articles such as these, only the first 200 Twitter or Facebook posts will count towards the score, in order to prevent articles with lots of identical social media posts from having much higher scores than articles with examples of more legitimate, unique attention.
- Flagging up and monitoring suspect activity: where an output sees an unusual or unexpected amount of activity, an alert is sent to the Altmetric team, who investigate to determine whether or not the activity is genuine.
The most powerful tool we have against gaming, however, is that we display all of the mentions of each output on the details page. By looking beyond the numbers and reading the mentions, it is easy to determine how and why any item has attracted the attention that it has – and therefore to identify whether or not it is the type of attention that you consider of interest.
What’s not included in the attention score?
Lastly, it’s useful to remember that some sources are never included in the Altmetric attention score. This applies to Mendeley and CiteULike reader counts (because we can’t show you who the readers are – and we like all of our mentions to be fully auditable), and any posts that appear on the “misc” tab on the details page (misc stands for miscellaneous).
We get asked about the misc tab quite a lot, so I thought it would be good to explain the rationale behind it. We add mentions of an article to the misc tab when they would never have been picked up automatically at the point when we are notified of them. This could have been because we’re not tracking the source, or because the mention did not include the right content for us to match it to a research output. By adding posts like this to the misc tab, we can still display all the attention we’re aware of for an article without biasing the score through excessive manual curation.
We hope that by posting this blog, we’ve managed to shed some light on the Altmetric score and the methods that go into calculating it. As always, any comments, questions or feedback are most welcome. Thanks for reading!
Updated 27 June 2016 to change “Altmetric score” to “Altmetric attention score” throughout the post.
Register here to receive the latest news and updates from Altmetric