Top 100 2021 – Techno Remix

As we shared in our last two blogs (the Old School Remix and Feat. Subjects), we have decided not to produce our traditional Top 100 this year. We’re taking the year off to rethink and refresh our annual review of society’s engagement with research to produce a format that focuses our analyses on the unique opportunities our data offers: identifying emerging trends, highlighting examples of great engagement, and encouraging researchers to communicate their research and its outcomes as effectively as possible.
In place of our usual Top 100, our Head of Data Insights, Mike Taylor, is paying tribute to the Top 100 of years past with a series of blog posts that each take a different approach to compiling a ‘top 100’. This time Mike is taking a new approach that uses techniques that are usually used to iron out differences between citation data: subject normalization.
The Techno Remix
For those of you who have been following this series so far, you’ll recall that the original Top 100 (The Old School Remix) was based solely on the Altmetric Attention Score. Generally speaking, this was successful…until COVID arrived, and dominated scientific communications, like no other subject has done before (although Zika research showed many of the same signs, it didn’t take off in quite the same way).
So last year, we put aside the old Score-based approach and decided to divide the Top 100 into a series of discipline-based Top 5s – and this functioned well, enabling us to celebrate research from around the academy.
This year has been very similar: the Old School Top 100 for 2021 would have contained 98 COVID articles, and last year’s approach just 29.
In my third (and final!) Top 100 I’m putting aside both approaches in favour of a new method that’s inspired by the work of scientometricians from the last decade.
Broadly speaking, citation performance is different by discipline, format and age (just like altmetrics!) and researchers have sought to normalize these variations by developing field-normalized metrics. Examples include the Field-Weighted Citation Index (FWCI), the Relative Citation Ratio (RCR) and the Field Citation Ratio (FCR).
Although these all have differences in their approach, they all attempt to compare a publication’s performance with similar other publications. Typically this means calculating an average citation rate for other documents from the same year, same subject area and in the same format (eg. chapter or article).
For the first time (that I’m aware of), I’ve calculated a similar range of metrics across all Altmetric research outputs going back to 2010, using the Fields of Research taxonomy. This has given us the ability to present a Top 100 that’s based on this normalized Score Index, that doesn’t divide up the results by discipline, but does take discipline into account as part of the calculation.
I’ve also taken the liberty of presenting two Top 10s (for monographs and preprints to illustrate how these metrics might work in practice).
The big question for today is: does this work? Does this approach produce a Top 100 that fairly represents research from 2021, but appropriately celebrates well-shared publications using a well-known scientific approach?
My final blog post is scheduled to appear in the New Year – here I’ll be dissecting the three approaches, illustrating some commonalities and differences and arguing the merits of each approach.
Methodology and data
As I mentioned above, my approach to calculating this new metric, that endeavours to reduce the field-based differences between publications, is informed by the work of scientometricians on many other metrics.
The first step is to calculate average values over groups of publications. For example, I take the set of preprints published in 2015, in the field of Cardiorespiratory Medicine (1102): there’s 124 of these indexed by Dimensions. Of these, 100 have Altmetric Attention. Using our data, I can calculate a lot of metrics: the most useful ones are the percentage of publications with attention, and the average. I’ve picked out a few values below:
| With attention | Mentions | Average | Proportion(N = 124) | |
| Score | 100 | 2.20 | 80.65% | |
| 100 | 387 | 3.12 | 80.65% | |
| Wikipedia | 1 | 1 | 0.01 | 0.81% |
| News | 2 | 5 | 0.04 | 1.61% |
Table 1: Expected Altmetric values for Preprints, published in 2015, in the field of Cardiorespiratory Medicine
To illustrate how the numbers vary, here are some more values – this time from Oncology (but also preprints, from 2015):
| With attention | Mentions | Average | Proportion | |
| Score | 150 | 8.49 | 84.75% | |
| 150 | 1575 | 8.90 | 84.75% | |
| Wikipedia | 3 | 4 | 0.02 | 1.69% |
| News | 4 | 63 | 0.36 | 2.26% |
Table 2: Expected Altmetric values for Preprints, published in 2015, in the field of Oncology
For me, it’s interesting to note that while the percentage of preprints (proportion) with attention is similar for all four metrics, the mean values are very different.
So why do age and discipline matter so much? Preprints are very well accepted in some fields (Astronomy, Economics, etc), but much less in other fields (at least, until recently, COVID has seen a marked growth in medical preprints – although where this is sustained or applicable to other topics within medicine is unknown). And some fields age at different rates: humanities are much slower to get attention than AI; the latter will have likely had all the impact it’s likely to have after two years, whereas the humanities are just getting started. The same is true when comparing books and preprints: books are much slower than articles or preprints – so all these data points are important when calculating these values.
The next stage(*) is relatively straightforward: for each article, you look up the article by age, subject area and format, and divide what it actually got by what it might be expected to get. So a Preprint in Oncology from 2015 with a score of 4 gets an index of 4 / 8.49, or 0.47. We can say, then, that it is not performing as well as would be expected.
We can use the same approach to calculate values for journals, and funders, and universities, and of course, we can use it to compare OA and non-OA research too.
*The next stage isn’t quite the next stage. Many publications sit inside more than one subject area, and to calculate their benchmark values, we need to use one of a number of approaches. The FWCI, for example, calculates the mean value for each subject area/year/format, and then combines them using an Harmonic Mean. The FCR takes a similar approach, using a Geometric mean. Currently, my values are calculated on the basis of the fractions. So a journal that is 80% sports science and 20% food nutrition is compared against 0.8 of the sports science averages and 0.2 of the food nutrition. But this isn’t the time or place to dive into that detail!
The science bit
At last, the Top 100 Techno Remix! Is anyone surprised that COVID also dominates this chart? Probably not: of the 100 research outputs rising to the top using the normalized approach, 63 reference COVID (this includes a couple that aren’t about COVID, but are being referenced within that context). Interestingly, this places this Top 100 directly in the middle of the Old School variety (98 COVID publications) and last year’s approach (29 COVID publications).
You can download the list here, or view a public report here, and for Altmetric subscribers, here’s the link to the results in Explorer.
I’ve presented a breakdown of the subject areas associated with the publications (I’ll do this for all of the Top 100s in my final blog post)
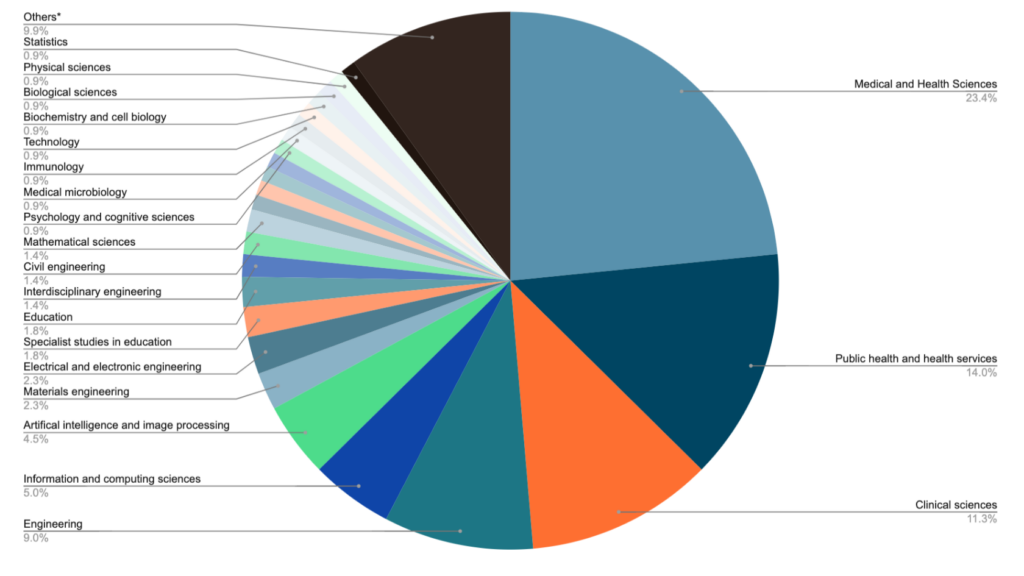
(Don’t forget that each publication can have up to 4 subject codes.)
Others*: Getting one publication each were the following subjects: Linguistics, Cultural Studies, Sociology, Studies in Human Society, Business and Management, Commerce, Management, Tourism and Services, Paediatrics and Reproductive Medicine, Cardiorespiratory Medicine and Haematology, Nanotechnology, Communications Technologies, Maritime Engineering, Manufacturing Engineering, Food Sciences, Environmental Engineering, Chemical Engineering, Computation Theory and Mathematics, Agricultural and Veterinary Sciences, Geophysics, Geology, Earth Sciences, Chemical Sciences.
Away from COVID, some of the usual suspects appeared: the paper on “cauliflower breath”, the archaeological paper on the Tunguska-sized meteorite, the rotating hip joint, plate tectonics and linguistic analysis of ExxonMobile’s climate change rhetoric are on both this version of the Top 100 and the last one. Climate change remains important, with 5 publications, as do Robotics and AI/emotions. The humanities and arts are less well-served by this approach – several of the interesting publications that were highlighted on the “Top 100 Feat. Subjects” with a focus on gender and race don’t appear in this version. Animals, however, remain important, with both parrots and ducklings making this list.
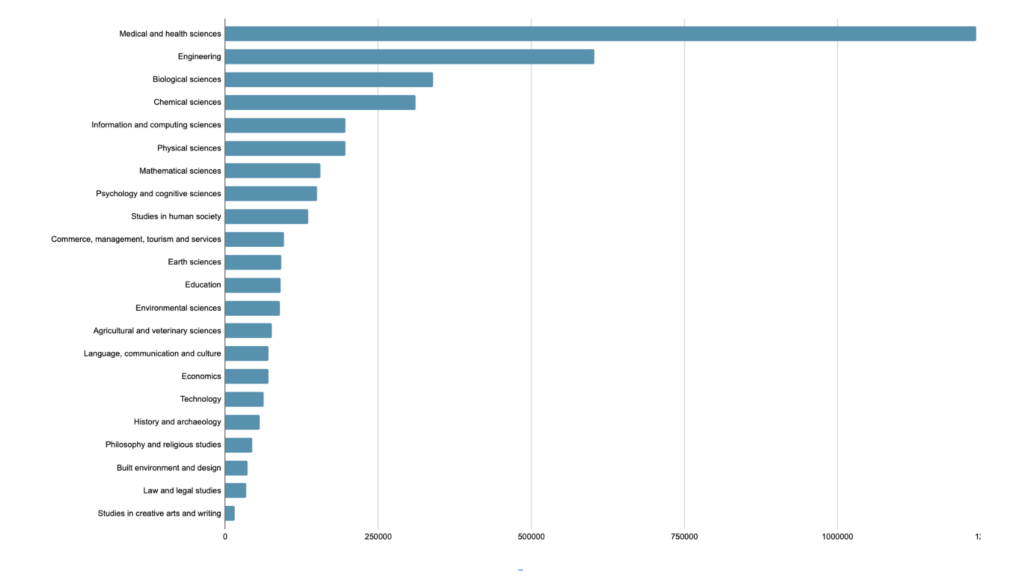
To some extent, this Top 100 better represents actual research output. This table, from Dimensions, shows the breakdown of publications by Field of Research code (just the top level, two digit codes):
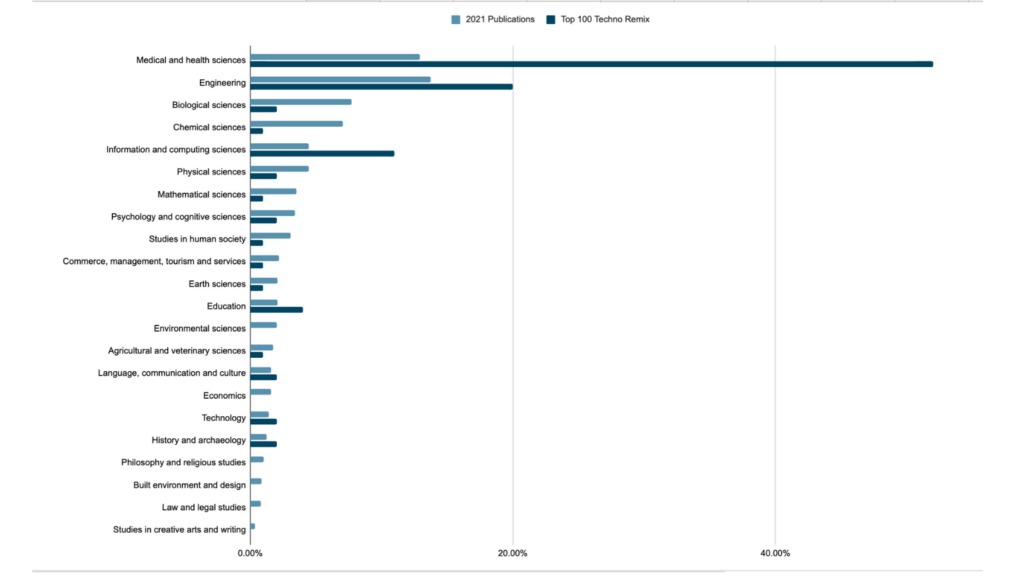
The table below compares the percentage breakdown of all 2021 publications (4395975!) by FoR with the percentage breakdown of this Top 100 by FoR.
This formulation of the Top 100 got a lot more attention than the Top 100 Feat. Subjects, including 1.5M Tweets, 35k News stories and Blog posts, and close to 200 Policy citations. Top institutions included: University of Oxford, Massachusetts Institute of Technology, Stanford University, Imperial College London, University of Cambridge, Stanford University and Huazhong University of Science and Technology. Institutions from other countries were represented, including Brazil, Mexico, Korea. I’ll run a further analysis on this in my final blog post.
The top 12 journals (and 1 preprint repository!) were:
- New England Journal of Medicine, 10 articles with 211,256 mentions
- MMWR: Morbidity & Mortality Weekly Report, 8 articles with 161,934 mentions
- The Lancet, 7 articles with 108,754 mentions
- Nature, 5 articles with 28,562 mentions
- Science, 5 articles with 65,890 mentions
- Nature Communications, 3 articles with 56,018 mentions
- Scientific Reports, 3 articles with 48,250 mentions
- JAMA Network Open, 2 articles with 44,641 mentions
- JAMA, 2 articles with 43,562 mentions
- Lancet Infectious Diseases, 2 articles with 40,501 mentions
- Nature Human Behaviour, 2 articles with 20,875 mentions
- Science Advances, 2 articles with 1048 mentions
- arXiv, 2 articles with 12,378 mentions
Having spent so much time focussing on (and celebrating) the most discussed research from 2021, I thought it’d be worthwhile also preparing a final Top 10 – to mark the most discussed Monographs. These represent a very different view into research, with the University of Michigan Press clearly hitting the nail on the head with their “Coronavirus Politics” monograph. I’m particularly cheered to see so many books from the Humanities and Social Sciences appear!
| Altmetric Attention Score | Title and Authors | Publisher |
| 880 | Coronavirus Politics, by Scott L. Greer, Elizabeth J. King, Elize Massard da Fonseca, André Peralta-Santos (Editors) | University of Michigan Press |
| 687 | Advanced Macroeconomics: An Easy Guide, by Filipe Campante, Federico Sturzenegger and Andrés Velasco Read | LSE Press |
| 303 | Medieval Ethiopian Kingship, Craft, and Diplomacy with Latin Europe, by Verena Krebs | Springer |
| 242 | Positive Body Image Workbook, by Nichole Wood-Barcalow, Tracy Tylkaand Casey Judge | Cambridge University Press |
| 183 | Rethinking Corporate Sustainability in the Era of Climate Crisis, by Raz Godelnik | Springer |
| 172 | Teaching the Entrepreneurial Mindset Across the University, by Lisa BosmanStephanie Fernhaber | Springer |
| 126 | Life after Fossil Fuels, by Alice J. Friedemann | Springer |
| 109 | Introduction to Python in Earth Science Data Analysis, by Maurizio Petrelli | Springer |
| 93 | Cultural and spiritual significance of nature: guidance for protected and conserved area governance and management, by Bas Verschuuren,, Josep-Maria Mallarach, Edwin Bernbaum, Jeremy Spoon, Steve Brown, Radhika Borde, Jessica Brown, Mark Calamia,Nora Mitchell, Mark Infield, and Emma Lee | International Union for Conservation of Nature |
| 93 | Industry Unbound by Ari Ezra Waldman | Cambridge University Press |
Conclusion
From my perspective, I’m really happy with the way that this final Top 100 has performed. Using a well-understood technique that borrows from existing scientometric literature, we’ve produced a Top 100 that required very little curation (just weeding out retracted articles, editorials and letters), but one that fairly represents research output. Yes, it’s disappointing to see some of the articles from the second version drop out, but I feel that having a split between 2/3rds COVID and 1/3rd non-COVID is a reasonable outcome, given how much attention the pandemic has inevitably attracted.
In the new year, I’ll be pulling apart the three approaches in a little more depth, and offering a more rigorous analytical view. If you’d like to join us on Twitter, you can find us at @altmetric and @herrison. Alternatively, you can comment below, or drop me an email at [email protected]
Our purpose in producing three Top 100s was to provoke discussion – and we look forward to hearing from you!
Happy holidays, from Mike at Altmetric Data Insights.
Register here to receive the latest news and updates from Altmetric