Twitter in scholarly communication

We are pleased to be publishing a series of blogs authored by scientometrics researcher Stefanie Haustein over the coming weeks. In this post, Stefanie introduces her blog series with an overview of the role that Twitter–one of the most-studied altmetrics of all time–plays in scholarly communication.
It’s almost been a decade since altmetrics and social media-based metrics were introduced. Since those early days they have been heralded as indicators of the societal impact of research—after all we all like, comment and share things on social media. An early study had seen tweets to predict citation impact shortly after an article was published, which got hopes up that Twitter activity could serve as an early indicator of research impact. However, the analysis was soon followed by several large-scale correlation studies, which showed that there is hardly any connection between tweet and citation counts. But other than proving that Twitter activity did not measure the same type of impact as those reflected by citations, low correlations did not help to understand what tweets linking to scholarly publications did actually measure.

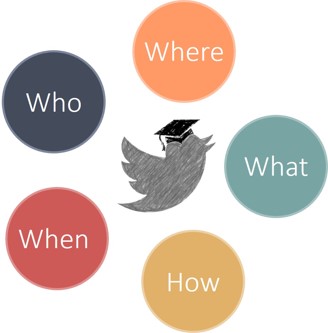
This mini series on scholarly Twitter metrics, to be published on the Altmetric blog over the next five weeks, will explore the What, Where, How, When and Who of academic Twitter, to shed some light on the significance of tweets in the context of social media metrics. The blog posts are based on a book chapter [1] for the Handbook of Quantitative Science and Technology Indicators edited by Wolfgang Glänzel, Henk Moed, Ulrich Schmoch and Mike Thelwall, which will be published later this year. A preprint of the chapter is available on arXiv.
Before getting down into the nitty-gritty of scholarly Twitter metrics, let’s have a look at how Twitter is being used in academia. The digital age, the open access and open science movements, and social media have all shaken up the scholarly metrics landscape; Twitter has been at the epicenter of this research evaluation earthquake. After Mendeley, Twitter has been the largest source of altmetric events, and together with Facebook it represents the platform with the greatest potential to reflect the public’s interest in research. Twitter currently has more than 330 million active users worldwide and reaches between one quarter and one third of the online population in the US and UK.
Although widely used by the public, Twitter uptake among academics is quite low. Depending on samples and time of data collection, most studies estimate academic Twitter use to be around 10% to 15% of scholars. Even though many researchers are aware of Twitter, most do not tweet in a professional context. As a result, Twitter is often perceived as a shallow medium that is used to communicate “pointless babble”, which in turn leads to a greater reluctance against its use in academia. While as few as 6% of tweets by University faculty, postdocs and doctoral students link to scholarly articles, more than one fifth of recent journal articles are mentioned on Twitter, which suggests that at least a certain number of tweets to scholarly papers are sent by non-academic users. It is probably because of the combination of both high uptake by the general public and high altmetric activity, that Twitter has become the most popular data source of altmetrics research; the majority of studies either focuses on or includes tweets to scholarly publications.
Similarly to how the Science Citation Index influenced bibliometric research and research evaluation, the altmetrics landscape is being heavily shaped by data availability. The availability of tweet content and metadata via the Twitter APIs and through their data analytics service Gnip, which allow Altmetric and other altmetrics providers to purchase access, has also played an important role as to why Twitter has been a popular source of altmetrics. Because they started to systematically collect tweets linking to scholarly publications in 2012, Altmetric has become a particularly valuable data source for tracking Twitter activity related to journal articles and large scale and longitudinal Twitter research.
Analyzing 24 million tweets from the Altmetric data dump [2], the blog posts in the coming weeks will explore the What, How, Where, When and Who of Twitter activity related to scientific publications to provide some insight into the meaning of scholarly Twitter metrics. Going beyond the informative value of correlation coefficients, we will analyze the characteristics of frequently tweeted publications, dive into tweet content to explore the use of Twitter-specific affordances such as hashtags and retweets and analyze time patterns. The mini series concludes with a post on who is tweeting, to broach the issue of identifying users and their motivation to discuss scholarly publications online.
Any biases and particularities of tweets linking to scholarly documents will naturally be reflected in what, when, where and how research gets shared on Twitter and who shares it. These characteristics of tweeting behavior need to be taken into consideration when interpreting Twitter metrics, and especially when using altmetrics in the context of research evaluation.
On Thursday, I’ll begin my weekly series of posts about scholarly Twitter metrics by examining what kinds of documents get tweeted the most, be sure to check back in then! In the meantime, you might want to read more about Twitter’s role in scholarly communication in the chapter.
[1] The blog posts focus on the two datasets used in the chapter: all 24 million tweets captured by Altmetric and a subset of 3.9 million tweets linking to papers published 2012 and covered by the Web of Science. For detailed descriptions of methods and related literature refer to the chapter.
[2] The chapter is based on the Altmetric data dump from June 2016.
Register here to receive the latest news and updates from Altmetric
