You are seeing a free-to-access but limited selection of the activity Altmetric has collected about this research output.
Click here to find out more.
Timeline
Attention over time
Attention Score history

Activity

X Demographics
Mendeley demographics
Login to view Mendeley reader trends over time.
| Title |
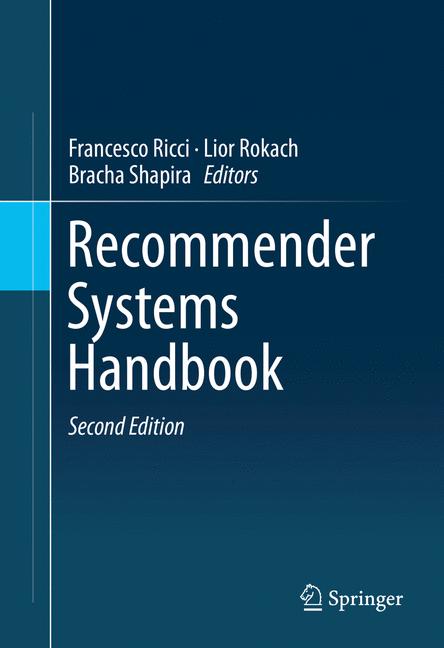
Recommender Systems Handbook
|
|---|---|
| Published by |
Springer US, January 2015
|
| DOI | 10.1007/978-1-4899-7637-6 |
| ISBNs |
978-1-4899-7636-9, 978-1-4899-7637-6
|
| Editors |
Francesco Ricci, Lior Rokach, Bracha Shapira |
Login to access the Attention Digest and the Sentiment Analysis related to this output.
X Demographics
The data shown below were collected from the profiles of 64 X users who shared this research output. Click here to find out more about how the information was compiled.
Geographical breakdown
| Country | Count | As % |
|---|---|---|
| United States | 10 | 16% |
| Spain | 8 | 13% |
| Netherlands | 6 | 9% |
| Ireland | 3 | 5% |
| United Kingdom | 3 | 5% |
| Belgium | 2 | 3% |
| Taiwan | 2 | 3% |
| Italy | 2 | 3% |
| Germany | 2 | 3% |
| Other | 11 | 17% |
| Unknown | 15 | 23% |
Demographic breakdown
| Type | Count | As % |
|---|---|---|
| Members of the public | 38 | 59% |
| Scientists | 24 | 38% |
| Practitioners (doctors, other healthcare professionals) | 2 | 3% |
Mendeley demographics
The data shown below were compiled from readership statistics for 697 Mendeley readers of this research output. Click here to see the associated Mendeley record.
Geographical breakdown
| Country | Count | As % |
|---|---|---|
| Unknown | 697 | 100% |
Demographic breakdown
| Readers by professional status | Count | As % |
|---|---|---|
| Student > Master | 95 | 14% |
| Student > Ph. D. Student | 80 | 11% |
| Student > Bachelor | 50 | 7% |
| Researcher | 31 | 4% |
| Student > Doctoral Student | 28 | 4% |
| Other | 47 | 7% |
| Unknown | 366 | 53% |
| Readers by discipline | Count | As % |
|---|---|---|
| Computer Science | 195 | 28% |
| Engineering | 38 | 5% |
| Business, Management and Accounting | 24 | 3% |
| Social Sciences | 10 | 1% |
| Arts and Humanities | 7 | 1% |
| Other | 47 | 7% |
| Unknown | 376 | 54% |