Attention! A study of open access vs non-open access articles

There are lots of good reasons to publish in open access journals. Two of the most commonly given ones are the beliefs that OA articles are read more widely and that they generate higher citations (for more on this check out slide 5 of Macmillan’s Author Insights Survey, which is up on figshare).
Do open access articles get higher altmetric counts?
In celebration of Open Access week we decided we’d take a look at some hybrid journals to see if there was any discernible difference in the quantitative altmetrics between their open access and reader pays articles. We picked Nature Communications to look at first as it’s a relatively high volume, multi-disciplinary-within-STM hybrid journal (at least it was during our study period – it has gone fully OA now), selects articles for publication blind to OA / non-OA status and clearly marks up authors, license and subject areas in its metadata. Plus we sit in the same building.
Coincidentally Nature Publishing Group recently commissioned a study from RIN that indicates that the OA articles in Communications get downloaded more often than their reader pays counterparts. So does that hold true when looking at other altmetrics sources?
Prepping the data & first impressions
Using a combination of the Altmetric API and web scraping we pulled together data on all the Communications papers published between 1st October 2013 and 21st October 2014. You can find all of it on figshare.
The short answer is that yes, there does seem to be a significant difference in the attention received. We’re going to cover some of the highlights below, but feel free to take the dataset and delve deeper – there’s only so much we can cover in a blog post.
First let’s characterize the dataset. It contains 2,012 articles of which 1,395 (70%) are reader pays. The bulk of articles – 1,181 (59%) – are tagged ‘Biological sciences’ by the journal. 519 (26%) are ‘Physical sciences’, 193 (10%) ‘Chemical sciences’ and 104 (5%) ‘Earth sciences’. Only 4 of the 2,012 are reviews.
We grouped articles by month of publication so that we can control for the fact that some kinds of altmetric data accrues over time. You can see this clearly in the graph below – the median number of Mendeley readers for articles published in each month is the line in red.
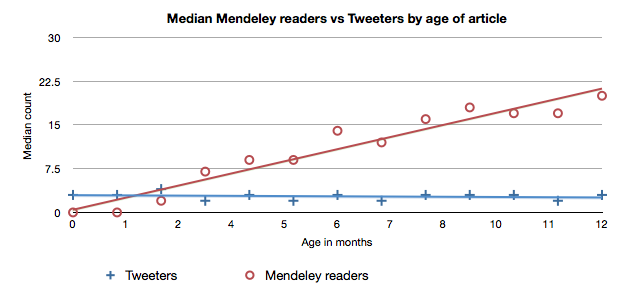
A tangent: every source is different
“Older articles have more” doesn’t hold true for all sources. I’ve plotted the median number of unique Twitter accounts talking about each paper by month of publication above too, in blue. Notice that the median actually trends down very slightly as we look at older papers.
This is because: (1) most tweeting happens very quickly after publication and (2) the Twitter userbase is growing incredibly rapidly so there are more people tweeting papers each month.
Think about it this way: if you compared a paper published in 2009 to a paper published in 2014, the 2009 paper would have lots of citations (accrued over time) and hardly any tweets (as not many researchers were tweeting when it was first published – Twitter was still very new). The 2014 paper would have hardly any citations but lots of tweets (as there is now a large number of tweeting researchers).
This is sometimes addressed in novel ways in altmetrics research: Mike Thelwall’s paper in PLoS One presents one elegant solution to a similar issue.
An initial hypothesis
Let’s get back to OA vs reader pays. Here in the office our initial hypothesis was that there would be an OA advantage for tweets in general as a larger audience would be more inclined to read and tweet the paper, but that the effect would be much less pronounced in Mendeley readership and amongst people who regularly tweet scientific papers.
Here’s the median number of tweeters over time, comparing the two cohorts in each month of publication:

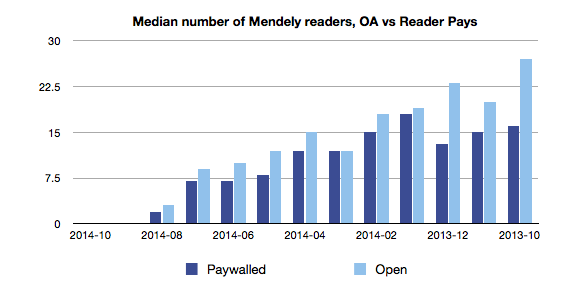
And the median number of Mendeley readers (remember that newer articles won’t have many Mendeley readers yet):
To get a feel for the data we graphed means and 3rd quartiles too. Here’s the mean number of tweeters who regularly tweet scientific papers:
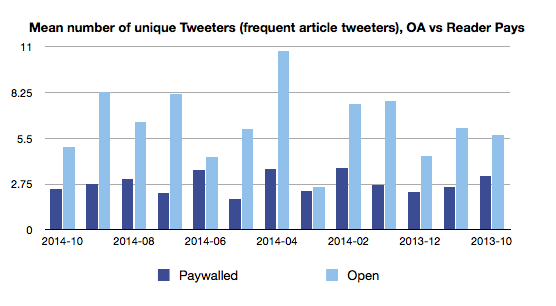
There’s a lot of light blue in these graphs and just eyeballing the data does seem to indicate an advantage for OA papers. But is it significant? Once we establish that we can start considering confounding factors.
If we look at all of the articles published in Q4 ’13 (to give ourselves a decent sized sample) we can compare the two cohorts in detail and do some sanity checking with an independent t-test. We’ll look at average author and references counts too in case they’re wildly different, which might indicate an avenue for future investigation.
Here are the results:
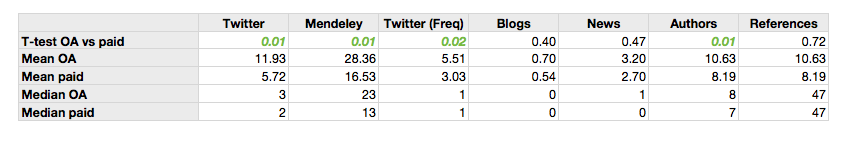
It seems like there is a difference between the number of tweets, the number of tweets by ‘frequent article tweeters’ and Mendeley readers.
The idea that the effect may be less pronounced for Mendeley doesn’t really hold water – a median of 23 readers for OA articles vs 13 for the reader pays is a pretty big difference.
Interestingly we didn’t see much difference in the number of news outlets or blogs covering papers in the two cohorts. A lot of news coverage is driven by press releases, and on the Nature side there is no preference for OA over reader pays when picking papers to press release (we checked).
Confounders
If we accept that the articles published as open access did get more Twitter and Mendeley attention the next obvious question is why?
Two things to check spring immediately to mind:
- Do authors select open access for their ‘best’ papers, or papers they think will be of broader appeal?
- People tweet about life sciences papers more than they do physical sciences ones. Perhaps the OA cohort has a higher number of biomedical papers in it? Notice that the OA cohort also has more authors, on average, than reader pays cohort. Might that be an indicator of something?
Do authors select only their ‘best’ papers for open access?
It doesn’t seem like we can discount this possibility. Macmillan’s author insight survey (warning: PDF link) have 48% of scientists saying “I believe that research should be OA” as a reason to publish open access, which leaves 52% who presumably have some other reason for wanting to do so. 32% have “I am not willing to pay an APC” as a reason not to go OA. The APC for Nature Communications is $5,200.
Are the higher altmetrics counts a reflection of subject area biases?

There doesn’t seem to be that much difference when we look at top level subjects, though it might be worth pulling out the Earth Sciences articles for a closer look.
That said, some disciplines definitely see more activity than others: if we look only at articles with the keyword ‘Genetics’ across our entire dataset, taking the median of unique tweeters per article each month then the ‘median of medians’ for OA is 21 and 6 for reader pays.
Compare that to ‘Chemical Sciences’ where the OA median of medians is only 3, and for reader pays it’s 2.
Wrapping up
Open access articles, at least those in Nature Communications, do seem to generate significantly more tweets – including tweets from people who tweet research semi-regularly – and attract more Mendeley readers than articles that are reader pays.
It seems likely that the reasons behind this aren’t as simple as just a broader audience. We’ve also only been looking at STM content.
Would we find the same thing in other journals? We deliberately looked within a single journal to account for things like differences in how sharing buttons are presented and to control for different acceptance criteria, and the downside to this is we can’t generalise, only contribute some extra datapoints to the discussion.
We’ll leave further analysis on those fronts as an exercise to the reader. Again, all the data is up on figshare. Let us know what you find out and we’ll follow up with another blog post!
You can get the dataset from and the PDF of this post here: Adie, Euan (2014): Attention! A study of open access vs non-open access articles. figshare. http://dx.doi.org/10.6084/m9.figshare.1213690
Register here to receive the latest news and updates from Altmetric