This is the second in a series of blog posts on the role Twitter plays in scholarly communication.
One of the initial hopes of altmetrics, particularly those based on tweets, was that they might help to democratize the data we use to understand research impact and make measures fairer by reducing geographical and language biases. Unlike citation data from the US-centric Web of Science, which by definition does not cover journals without English abstracts and thus underrepresents publications from the Global South, altmetrics were seen by many as being free of national and language biases. But, while Twitter users can tweet in any language and—with a few exceptions—from anywhere in the world, analyses of tweets linking to scientific papers have shown that the same or similar biases persist and are often even intensified on Twitter.
Identifying tweet locations is complicated
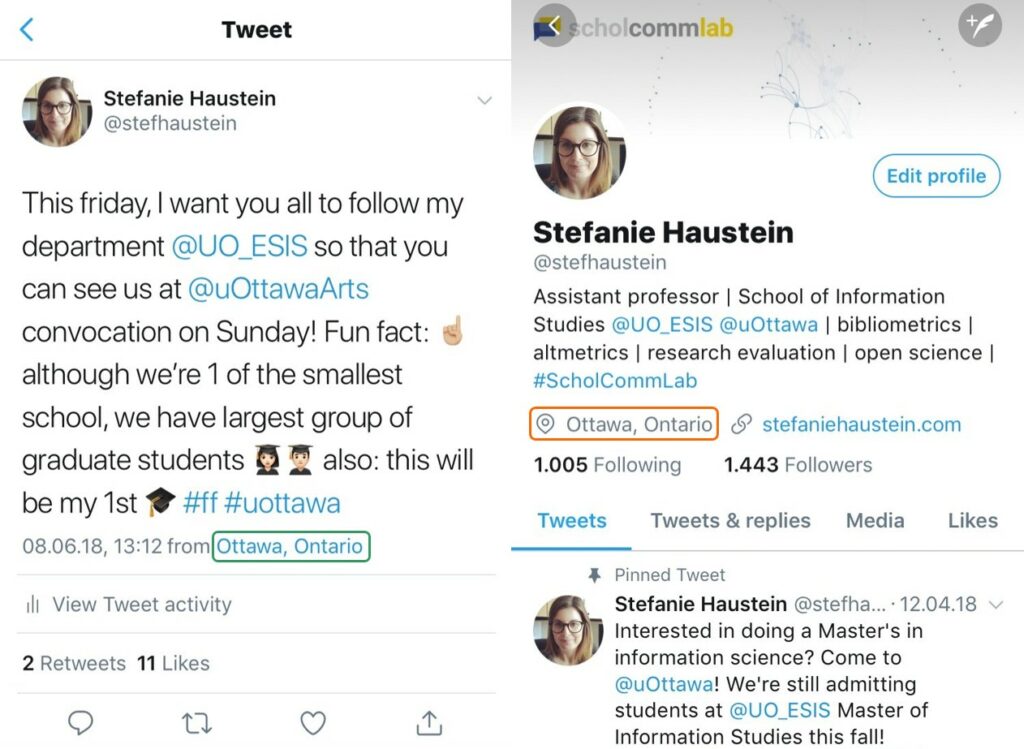
Today’s post will focus on where users tweeting scientific articles are located. To begin to unpack this, we need to understand how we can identify locations, based on available Twitter data. Twitter provides the possibility to geotag each tweet with precise latitude-longitude information of a user’s location at the time of tweeting (e.g., geocoded tweet location for Ottawa, Ontario marked in green in the Figure below). So theoretically geotagged tweets would allow for rich data to locate where research literature is discussed frequently. Combining author addresses from publication metadata with geotags from Twitter would thus provide a unique angle to analyze where research is produced and where it is used. Adding a temporal layer, we could even explore how scientific information and associated hashtags spreads geographically. However, as we will see in today’s post, determining a tweeter’s geolocation is not as straightforward in praxis as it might seem in theory.
Geotagging tweets is not a default setting
Although tweets can be tagged with exact latitude-longitude information, geotagging is not activated by default, so that less than 5% of tweets actually contain geo coordinates. Instead, when Twitter gives data to companies like Altmetric, they try to enrich geo locations of tweets based on information in users’ Twitter bios (e.g., Twitter bio location marked in red). Since that information is not generated automatically but freely edited by users, it requires some processing to determine the user’s location. A study in 2012 showed that while only 8% of profiles contained specific latitude-longitude information, a bit more than half of Twitter profiles linked to an exact location, one fifth to a country, and 15% to fictional places such as “Hogwarts”. So, while we there is a lot of Twitter location data out there, it does not necessarily provide accurate information about where tweets linking to scientific publications where sent from.
Twitter bios help to enrich location information
Based on the Twitter data provided by Gnip, Altmetric is able to show location information for 58% of its tweets. Due to the lack of granular geotags, Altmetric’s products—the Altmetric Explorer and details pages—limit geolocation to the country level. The Altmetric dump file distributed for research purposes contains the latitude-longitude data based on geotags and Gnip’s enriched geolocations. Since this blog post is based on the handbook chapter, which analyzed the Altmetric data dump from June 2016, we can have a look at this more granular data to determine tweet locations. Aggregating the number of tweets and users per geolocation, it becomes apparent that Twitter’s enriched location information is not accurate enough to determine exact locations. Whenever the Twitter bio information is not detailed enough to identify a city, geographical midpoints on the country level serve as a proxy: For example, among the top 10 geolocations based on number of unique users in the Altmetric data dump, Penrith—close to the geographical center of the UK—is the third most prevalent location. Ranked 8th and 9th, Esbon and Center in Kansas are close to the midpoint of the US. While it is quite plausible that the majority of tweets linking to scientific papers are sent from users in London, New York, DC and Toronto, it is less credible that remote locations in the US and UK play a major role.
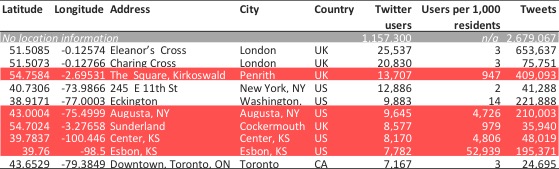
When using the geotags provided in the Altmetric dump file, cleaning latitude-longitude information is thus a prerequisite for analyzing the location of Twitter users below the country level. The number of users per resident might be a metric to identify such unprobable locations stemming from geographical midpoints as country proxies: the plausible locations have a user-resident ratio of less than 15 Twitter users per 1,000 residents, while the ratios for the less probably locations is almost 1:1 or higher.
One third of tweets linking to papers are from the US, UK and Canada
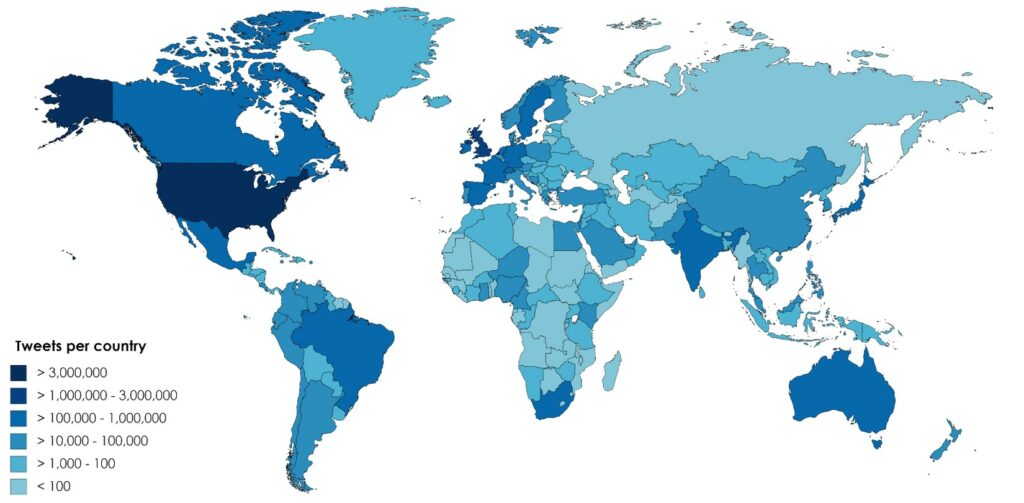
Without cleaning of latitude and longitude data, the analysis of where users tweet scholarly documents from needs to be restricted to the country level. Users from the US are the most active tweeters, with 20% (4.8 million) of tweets are sent by just over half a million distinct Twitter users. They are followed by the UK (11% of tweets), Canada, Australia and Spain (3% each). With one exception, the top 10 countries—in terms of number of tweets—are all large countries in Europe or North America (see map). In the 2016 research dataset we worked with, the exception is a small Caribbean island named Saint Vincent: it ranks seventh behind Japan in terms of number of tweets and places third behind the US and UK ranked by number of tweeted documents. That’s more than three tweets per resident! The Saint Vincent tweets actually point to a misclassification of users with ‘worldwide’ locations by Twitter’s geo-enriching algorithm. The bug that was fixed in August 2016 and Altmetric reclassified the ‘worldwide’ locations as ‘unknown’ countries. This example illustrates that user-provided information from the Twitter bio is often not exact and attempts by data providers such as Gnip and Altmetric to enrich this data does not always yield accurate results. In terms of number of users instead of tweets, Saint Vincent places 45th behind Singapore.
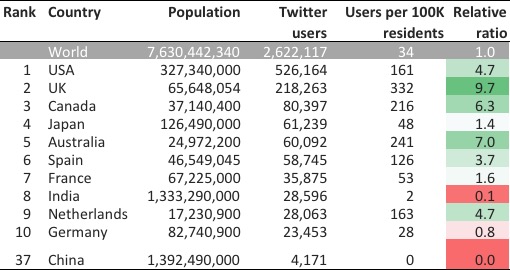
Countries in the top 10 (see table) change only slightly with India, Japan and France improving and Australia and Spain losing a rank. The user-resident ratio and the relative to the world average indicate that China, India and Germany (relative ratio <1) are underrepresented among countries tweeting about scholarly papers, while the UK, Australia, Canada, the US and the Netherlands are particularly overrepresented (relative ratio >4.5). The data shows that Twitter geolocations should only be used as a proxy and not an exact indication of where scientific papers are tweeted. Based on the Altmetric data dump, location information is available for less than two-third of tweets, which can be used to identify country-level data. Data cleaning is absolutely essential before analyzing latitude- longitude information.
English tweets prevail
Given the location of the Twitter users who shared publications, it is perhaps unsurprising, that the majority of tweets are in English. Even when the research topic is one that is most relevant in non-English speaking places, English-language tweets prevail. For example, when the Zika outbreak was considered an international emergency by WHO in February 2016, research naturally circulated on social media, but even though the people most affected spoke Portuguese, 90% of the Tweets that linked to the scientific publications were in English. Facebook was marginally less monolingual, with 76% of posts in English. This result reveals not only the language preferences of people sharing research on social media—and consequently any derived metrics—but also the importance of considering which online platforms are most relevant in different scenarios and contexts. For example, in the case of research about a disease that foremost affected Brazilians, it seems that posting articles on Facebook had a higher probability of reaching local, non-anglophone communities.
Geographic biases in Twitter metrics
So what does this mean for tweets as scholarly metrics? When using Twitter data to understand online activity related to scientific journal articles, one needs to consider that one third of tweets come from users in the US, UK and Canada and that the great majority of discussions are in English. Therefore scholarly Twitter metrics do by no means democratize research impact: instead of reducing known tendencies towards English speaking countries in the Global North, indicators based on tweets seem to intensify existing biases favoring authors from the US and UK. Since authors, institutions, publishers and funders are more likely to diffuse their own publications on Twitter, research from other regions might thus be overlooked. Papers authored by scholars from countries blocking Twitter (i.e., China, Iran and North Korea) and other platforms might thus be deprived of social media attention. Were tweet-based metrics used to evaluate any form of impact, researchers from these countries would be at a disadvantage, possibly missing out on funding and promotion. On the contrary, if microblogging activity was based on Weibo instead of Twitter, Chinese scholars and publications are likely overrepresented, underrepresenting research and impact from other parts of the world.
It is also important to keep in mind that any user-provided location information used to enrich geotags is a mere proxy of actual location, as algorithms turning freetext into location data are not not free of errors or the place provided in the Twitter bio might not be granular enough to identify an exact location. The geographic and language trends described above will naturally be reflected in what, who, how and when research gets shared on Twitter, which we will explore in the remaining posts on the Altmetric blog. As such, when interpreting altmetrics research, the location of users and associated biases need to be taken into consideration, especially when using altmetrics for research evaluation.
[1] Based on the Altmetric data dump from June 2016.
[2] The enriched geolocation of the Saint Vincent accounts point to a spot in the South Atlantic close to Antarctica (13,08333, -61.2).

Stefanie Haustein is assistant professor at the University of Ottawa’s School of Information Studies, whereshe teach research methods and evaluation, social network analysis and knowledge organization. Her research focuses on scholarly communication, bibliometrics, altmetrics and open science. Stefanie co-directs, together with Juan Pablo Alperin, the #ScholCommLab, a research group that analyzes all aspects of scholarly communication in the digital age. Stefanie tweets as @stefhaustein.

Dr. Germana Barata is a visiting scholar in the Publishing Program at Simon Fraser University and a science communication researcher at the Laboratory of Advanced Studies in Journalism (Labjor) and the Centre for the Development of Creativity (Nudecri) at the University of Campinas (Unicamp), Brazil. Barata’s research focuses on how social media and altmetrics (alternative metrics for measuring the societal impact of science) affect the value of Brazilian Science journals. She writes at Ciência em Revista and Diário de Vancouver, a monthly Vancouver diary for Jornal da Unicamp. A complete list of her publications and presentations can be found at ResearchGate.net, and she can be found on Twitter at @germanabarata.

Dr. Juan Pablo Alperin is a co-director of the #scholcommlab, as well as an Assistant Professor at the Canadian Institute for Studies in Publishing and an Associate Director of Research of the Public Knowledge Project at Simon Fraser University, Canada. A full list of publications and presentations can be found at ScholCommLab, and he can be found on Twitter at @juancommander.
Register here to receive the latest news and updates from Altmetric
We are pleased to be publishing a series of blogs authored by scientometrics researcher Stefanie Haustein over the coming weeks. In this post, Stefanie introduces her blog series with an overview of the role that Twitter–one of the most-studied altmetrics of all time–plays in scholarly communication.
It’s almost been a decade since altmetrics and social media-based metrics were introduced. Since those early days they have been heralded as indicators of the societal impact of research—after all we all like, comment and share things on social media. An early study had seen tweets to predict citation impact shortly after an article was published, which got hopes up that Twitter activity could serve as an early indicator of research impact. However, the analysis was soon followed by several large-scale correlation studies, which showed that there is hardly any connection between tweet and citation counts. But other than proving that Twitter activity did not measure the same type of impact as those reflected by citations, low correlations did not help to understand what tweets linking to scholarly publications did actually measure.
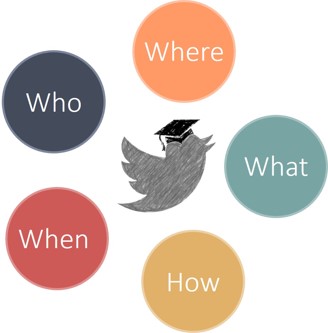
This mini series on scholarly Twitter metrics, to be published on the Altmetric blog over the next five weeks, will explore the What, Where, How, When and Who of academic Twitter, to shed some light on the significance of tweets in the context of social media metrics. The blog posts are based on a book chapter [1] for the Handbook of Quantitative Science and Technology Indicators edited by Wolfgang Glänzel, Henk Moed, Ulrich Schmoch and Mike Thelwall, which will be published later this year. A preprint of the chapter is available on arXiv.
Before getting down into the nitty-gritty of scholarly Twitter metrics, let’s have a look at how Twitter is being used in academia. The digital age, the open access and open science movements, and social media have all shaken up the scholarly metrics landscape; Twitter has been at the epicenter of this research evaluation earthquake. After Mendeley, Twitter has been the largest source of altmetric events, and together with Facebook it represents the platform with the greatest potential to reflect the public’s interest in research. Twitter currently has more than 330 million active users worldwide and reaches between one quarter and one third of the online population in the US and UK.
Although widely used by the public, Twitter uptake among academics is quite low. Depending on samples and time of data collection, most studies estimate academic Twitter use to be around 10% to 15% of scholars. Even though many researchers are aware of Twitter, most do not tweet in a professional context. As a result, Twitter is often perceived as a shallow medium that is used to communicate “pointless babble”, which in turn leads to a greater reluctance against its use in academia. While as few as 6% of tweets by University faculty, postdocs and doctoral students link to scholarly articles, more than one fifth of recent journal articles are mentioned on Twitter, which suggests that at least a certain number of tweets to scholarly papers are sent by non-academic users. It is probably because of the combination of both high uptake by the general public and high altmetric activity, that Twitter has become the most popular data source of altmetrics research; the majority of studies either focuses on or includes tweets to scholarly publications.
Similarly to how the Science Citation Index influenced bibliometric research and research evaluation, the altmetrics landscape is being heavily shaped by data availability. The availability of tweet content and metadata via the Twitter APIs and through their data analytics service Gnip, which allow Altmetric and other altmetrics providers to purchase access, has also played an important role as to why Twitter has been a popular source of altmetrics. Because they started to systematically collect tweets linking to scholarly publications in 2012, Altmetric has become a particularly valuable data source for tracking Twitter activity related to journal articles and large scale and longitudinal Twitter research.
Analyzing 24 million tweets from the Altmetric data dump [2], the blog posts in the coming weeks will explore the What, How, Where, When and Who of Twitter activity related to scientific publications to provide some insight into the meaning of scholarly Twitter metrics. Going beyond the informative value of correlation coefficients, we will analyze the characteristics of frequently tweeted publications, dive into tweet content to explore the use of Twitter-specific affordances such as hashtags and retweets and analyze time patterns. The mini series concludes with a post on who is tweeting, to broach the issue of identifying users and their motivation to discuss scholarly publications online.
Any biases and particularities of tweets linking to scholarly documents will naturally be reflected in what, when, where and how research gets shared on Twitter and who shares it. These characteristics of tweeting behavior need to be taken into consideration when interpreting Twitter metrics, and especially when using altmetrics in the context of research evaluation.
On Thursday, I’ll begin my weekly series of posts about scholarly Twitter metrics by examining what kinds of documents get tweeted the most, be sure to check back in then! In the meantime, you might want to read more about Twitter’s role in scholarly communication in the chapter.
[1] The blog posts focus on the two datasets used in the chapter: all 24 million tweets captured by Altmetric and a subset of 3.9 million tweets linking to papers published 2012 and covered by the Web of Science. For detailed descriptions of methods and related literature refer to the chapter.
[2] The chapter is based on the Altmetric data dump from June 2016.
Register here to receive the latest news and updates from Altmetric