Since Twitter became X…

The article has been prepared in collaboration with Carlos Areia, Data Scientist at Digital Science, and Mike Taylor, Head of Data Insights at Digital Science.
Data collected in 2022 confirmed Twitter’s value, especially amid increased scholarly attention during the COVID era. Renamed as X, the platform’s rapid transformations since October 2022 have indeed altered its dynamics. And yet, X remains important for research dissemination. The current data shows that despite a decline in activity, X’s engagement remains higher than pre-COVID levels, underscoring its place in the research discourse.
In February 2023, we published a piece, Twitter and the changing conversation, that looked at the continuing value of including data from Twitter in Altmetric, the reflective piece being prompted by the rapidly changing nature of Twitter and the associated uncertainty. The data collected up to December 2022 indicated that Twitter still had huge value as a platform. During the COVID years, our data showed increased attention to scholarly research across all disciplines, not just in the biomedical and health sciences. Altmetric went from collecting 1.9 million research tweets a month to over 3 million a month. However, starting in October 2022, changes have been even more rapid and, at times, dramatic. It’s safe to say that one of the constants of the platform formerly known as Twitter – now called X – has been “change.” So we decided to look at the updated data and see which of our previous conclusions remain true.
Getting over the COVID-19 hangover
The COVID-19 pandemic upended many systems, not least the information dissemination on social media: as mentioned above, our data showed a spike in attention for all kinds of research, but especially those related to health sciences. From 2020 to 2023, the majority of research papers gaining the highest Altmetric Attention Scores were related to COVID-19 research. And this spike was not just in the volume of posts: the increase was also seen in the number of users engaging in conversations. However, there has been a slight decline in the number of posts collected from those pandemic spikes (Fig. 1).
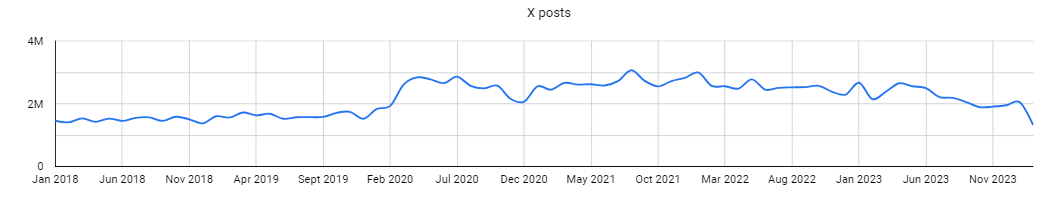
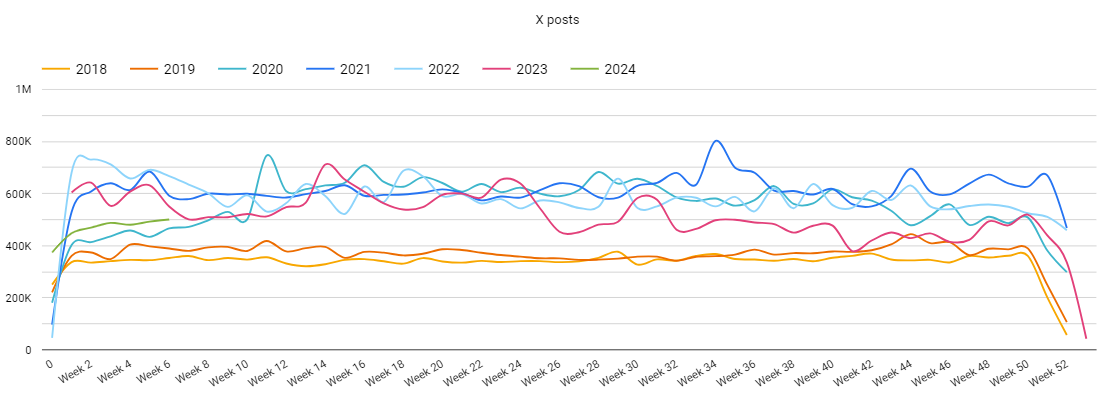
“If we look at the number of posts collected from 2023 to January 2024, our data shows these are gradually decreasing from the peak pandemic years; however, they still remain higher than the pre-COVID era, with more than 2 million posts collected in January 2024” says Dr Carlos Areia, Data Scientist at Digital Science. “We continue to receive almost 500,000 posts every week, but we have noticed a dip in both research-linked posts and the number of users sharing research when we compare current activity with the pandemic years,” he adds. (Fig. 2)
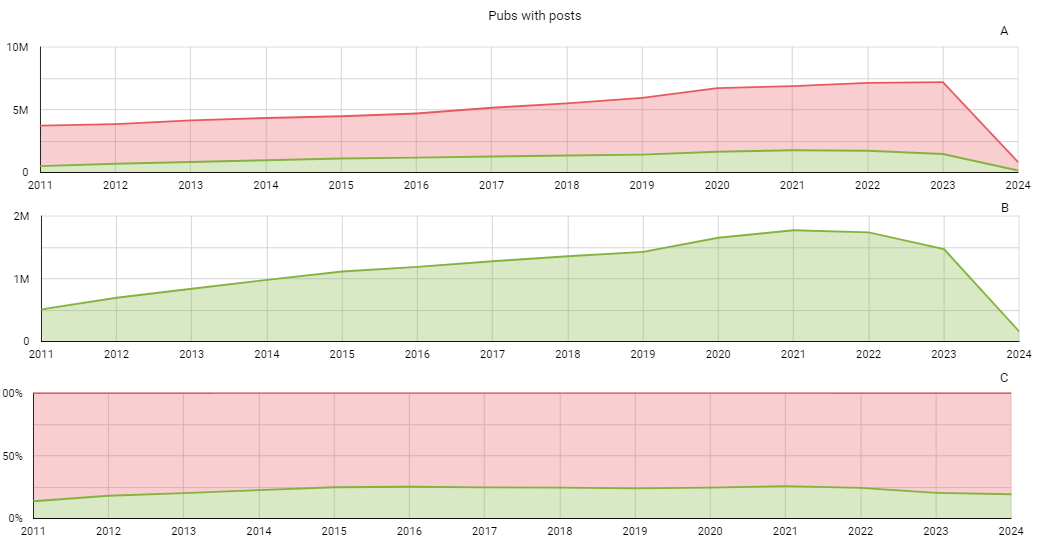
Another signal worth exploring was how the ratio of research publications with and without posts changed over time. The percentage of publications with tweets showed an increase from 14% in 2011 to 25% in 2015 and remained at similar levels till 2022, with a decrease to 20% in 2023.
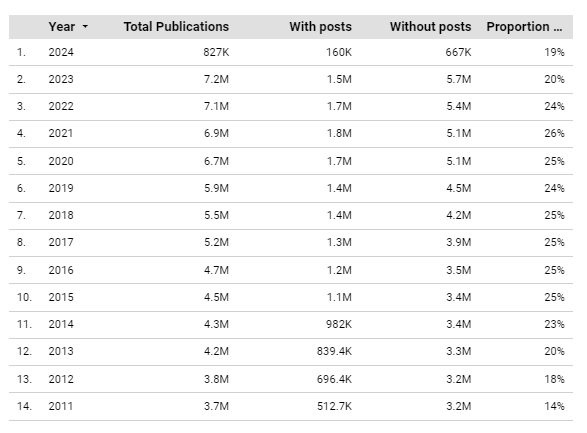
As before, the number of publications with at least one post on Twitter/X showed a sharp increase during the pandemic years, with a slight decrease from 2022 to 2023, despite the continuous growth in the number of publications.
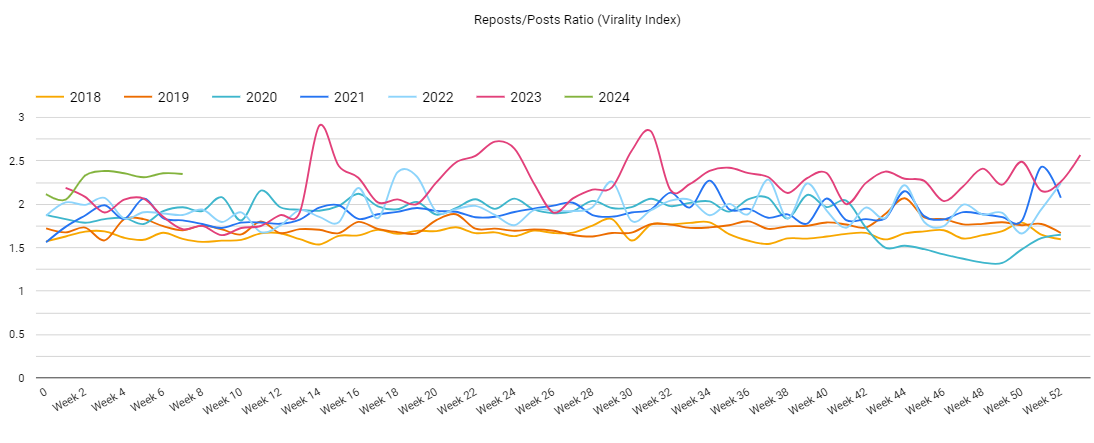
A high repost-to-post ratio
One criterion for quantifying the ‘virality’ of a post is to check the ratio of repost to post. Our data shows the 2023 trend of the repost-to-post ratio has been higher than in past years (Fig. 4). Similarly, a Pew Research Center study (see point 6) focusing on U.S. adult users between October 2022 and April 2023 found that the majority of posts on X are either replies or reposts, with three-quarters of these posts being either replies to other users (40%) or reposts (35%). The rest were original posts (15%) or quoted posts (9%). If ‘virality’ can be considered one way to measure attention, our data shows that posts on X still generate substantial levels of engagement with research.
Insights into profiles
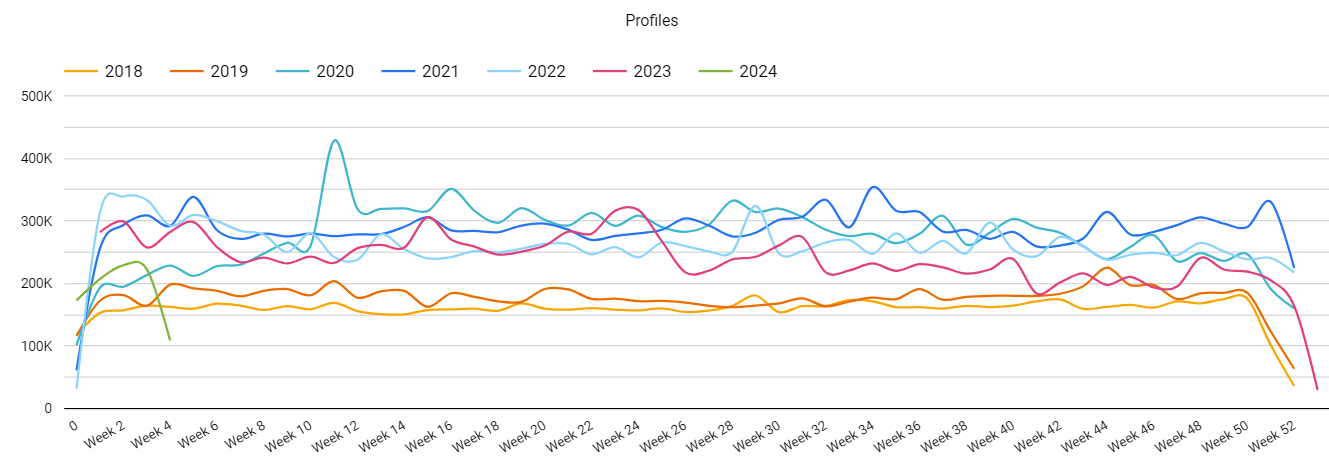
“We looked at the number of users actively sharing research on X from 2018 to 2024, and the pattern is almost similar to what we have seen in the number of posts per week. There is a gradual decrease in comparison to the pandemic period, but the current numbers are still higher than 2018/2019, with over 200,000 users actively sharing research on X per week,” says Dr Areia. (Fig. 5)
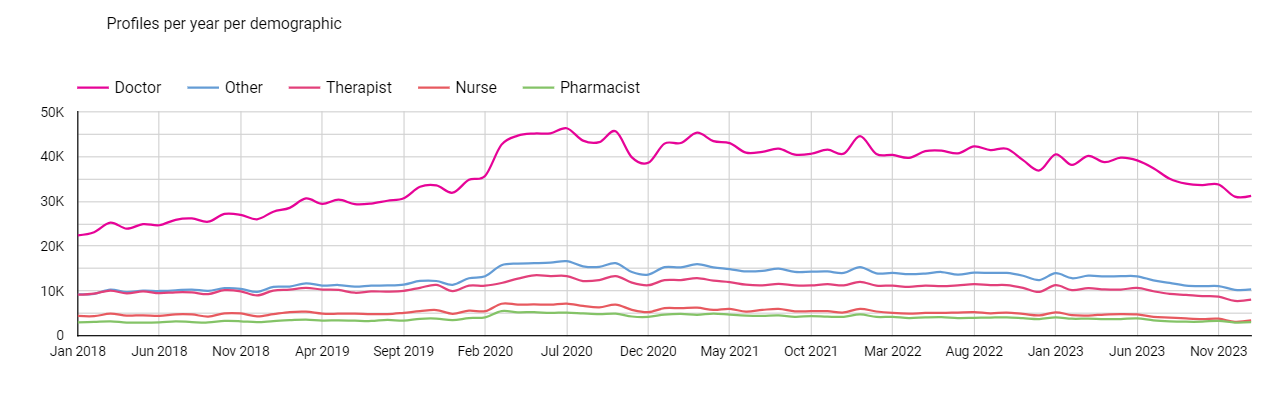
Since early 2023, we have continued to monitor and measure X users’ demographics. Last year, we mentioned the “largest increase was seen amongst users who are not in the academic domain at all. Prior to March 2020, the Twitter profiles we saw mentioning research consisted of roughly 66% “uncategorized” users, which is users that are not considered a part of the medical, academic, or research communities.”
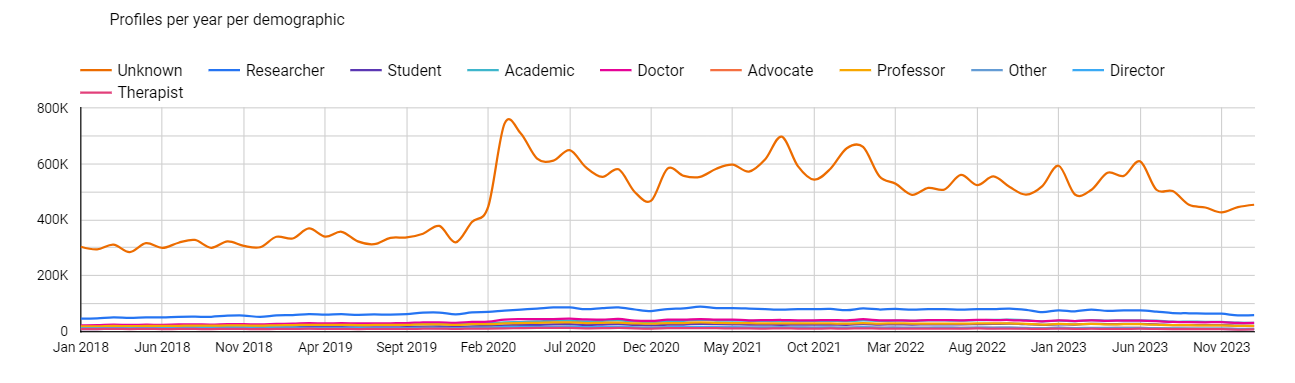
Looking at the updated numbers, the message remains, with a slight decrease in the “uncategorized users” over the past few months (Figs. 6 & 7). Drilling down, we explored the activity of X “clinical users” (to know more about how bespoke Altmetric tools can be used to categorize user profiles, analyze cohorts of researchers, and more, read Gaining deeper insights into Twitter conversations), that had a similar trend. However, despite the slight decrease since the pandemic era, there is still significant research-sharing activity on X from clinicians.
To stay (on X) or not to stay
That X has lost the momentum of activity it gained during the COVID-19 pandemic is evident. A survey published in Nature reveals that scientists are cutting back from using X. But migrating to other platforms and reproducing an identical community is almost impossible. Casey Fiesler, Associate Professor of Information Science, University of Colorado Boulder, wrote an article for The Conversation, saying: “There is essentially zero chance that Twitter, as it exists now, could be reconstituted on another platform. Any migration is likely to face many of the challenges previous platform migrations have faced: content loss, fragmented communities, broken social networks, and shifted community norms.”
X also continues to be an important destination for news. A Reuters Institute and University of Oxford research published in 2023 concluded that Twitter’s use for news has remained consistently stable over the last decade despite various changes and that it is notably regarded as a destination for news, especially political news from mainstream, alternative sources, and politicians.
For Altmetric, the aggregated data continues to show that X has significant value as a research dissemination platform and remains the leading source of our social media attention. Activity is still higher than pre-COVID levels, with over 600,000 unique users and more than 2 million “research linked” posts recorded per week in January 2024 alone. Our conclusion from last year still holds true: the stories that our data tells can help inform publications and research strategies far beyond social media and show how research publications can have an impact beyond the academic sphere.
For more information about how to use Altmetric, contact the Altmetric team.